- GWT Highcharts - Home
- GWT Highcharts - Overview
- Environment Setup
- Configuration Syntax
- GWT Highcharts - Line Charts
- GWT Highcharts - Area Charts
- GWT Highcharts - Bar Charts
- GWT Highcharts - Column Charts
- GWT Highcharts - Pie Charts
- GWT Highcharts - Scatter Chart
- GWT Highcharts - Dynamic Charts
- GWT Highcharts - Combinations
- GWT Highcharts - 3D Charts
- GWT Highcharts - Map Charts
- GWT Highcharts Useful Resources
- GWT Highcharts - Quick Guide
- GWT Highcharts - Useful Resources
- GWT Highcharts - Discussion
Selected Reading
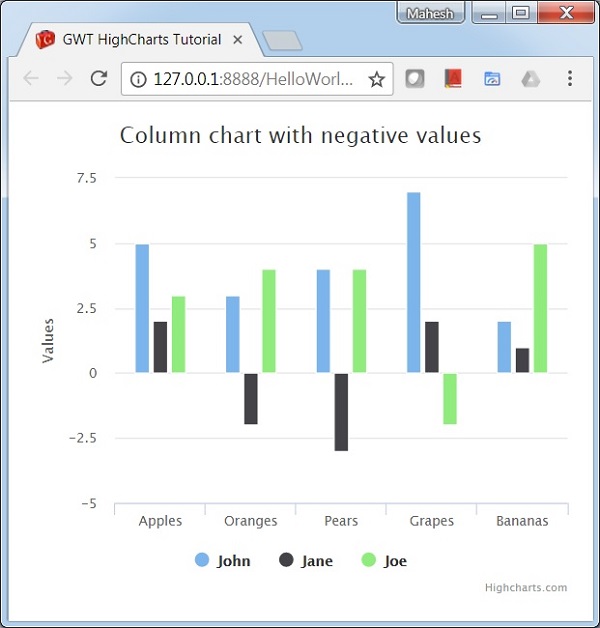
Column Chart with negative values
Following is an example of a Column Chart with negative values.
We have already seen the configurations used to draw a chart in Highcharts Configuration Syntax chapter. Now, let us see an example of a basic column chart with negative values.
Example
HelloWorld.java
package com.tutorialspoint.client;

import org.moxieapps.gwt.highcharts.client.Chart;
import org.moxieapps.gwt.highcharts.client.Series.Type;

import com.google.gwt.core.client.EntryPoint;
import com.google.gwt.user.client.ui.RootPanel;

public class HelloWorld implements EntryPoint {
   public void onModuleLoad() {
      final Chart chart = new Chart()
         .setType(Type.COLUMN)
         .setChartTitleText("Column chart with negative values");
      chart.getXAxis()
         .setCategories("Apples", "Oranges", "Pears", "Grapes", "Bananas");
      chart.addSeries(chart.createSeries()
         .setName("John")
         .setPoints(new Number[] { 5, 3, 4, 7, 2 })
      );
      chart.addSeries(chart.createSeries()
         .setName("Jane")
         .setPoints(new Number[] { 2, -2, -3, 2, 1 })
      );
      chart.addSeries(chart.createSeries()
         .setName("Joe")
         .setPoints(new Number[] { 3, 4, 4, -2, 5 })
      );
      RootPanel.get().add(chart);
   }
}
Result
Verify the result.
gwt_highcharts_bar_charts.htm

Advertisements