- GWT Highcharts - Home
- GWT Highcharts - Overview
- Environment Setup
- Configuration Syntax
- GWT Highcharts - Line Charts
- GWT Highcharts - Area Charts
- GWT Highcharts - Bar Charts
- GWT Highcharts - Column Charts
- GWT Highcharts - Pie Charts
- GWT Highcharts - Scatter Chart
- GWT Highcharts - Dynamic Charts
- GWT Highcharts - Combinations
- GWT Highcharts - 3D Charts
- GWT Highcharts - Map Charts
- GWT Highcharts Useful Resources
- GWT Highcharts - Quick Guide
- GWT Highcharts - Useful Resources
- GWT Highcharts - Discussion
Selected Reading
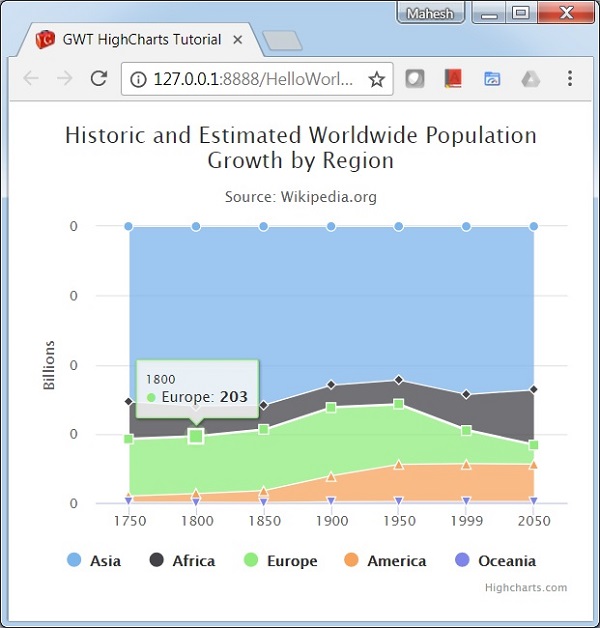
GWT Highcharts - Percentage Area Chart
Following is an example of a stacked Area Chart.
We have already seen the configurations used to draw a chart in Highcharts Configuration Syntax chapter. Now, let us see an example of a stacked Area Chart.
plotOptions
The plotOptions is a wrapper object for configuration objects for each series type. The configuration objects can be overridden for each series item as given in the series array. This is to stack the values of each series on top of each other.
Configure the stacking of the chart using plotOptions.area.stacking as "normal". Possible values are null which disable stacking, "normal" stacks by value and "percent" stacks the chart by percentages.
chart.setAreaPlotOptions(new AreaPlotOptions()
   .setStacking(Stacking.PERCENT)
   .setLineColor("#666666")
   .setLineWidth(1)
   .setMarker(new Marker()
      .setLineWidth(1)
      .setLineColor("#666666")
   )
);
Example
HelloWorld.java
package com.tutorialspoint.client;

import org.moxieapps.gwt.highcharts.client.Chart;
import org.moxieapps.gwt.highcharts.client.Series.Type;
import org.moxieapps.gwt.highcharts.client.ToolTip;
import org.moxieapps.gwt.highcharts.client.ToolTipData;
import org.moxieapps.gwt.highcharts.client.ToolTipFormatter;
import org.moxieapps.gwt.highcharts.client.XAxis;
import org.moxieapps.gwt.highcharts.client.YAxis;

import org.moxieapps.gwt.highcharts.client.labels.AxisLabelsData;
import org.moxieapps.gwt.highcharts.client.labels.AxisLabelsFormatter;
import org.moxieapps.gwt.highcharts.client.labels.YAxisLabels;

import org.moxieapps.gwt.highcharts.client.plotOptions.AreaPlotOptions;
import org.moxieapps.gwt.highcharts.client.plotOptions.Marker;
import org.moxieapps.gwt.highcharts.client.plotOptions.PlotOptions.Stacking;

import com.google.gwt.core.client.EntryPoint;
import com.google.gwt.i18n.client.NumberFormat;
import com.google.gwt.user.client.ui.RootPanel;

public class HelloWorld implements EntryPoint {
   public void onModuleLoad() {
      Chart chart = new Chart()
         .setType(Type.AREA)
         .setChartTitleText("Historic and Estimated Worldwide Population Growth by Region")
         .setChartSubtitleText("Source: Wikipedia.org")
         .setAreaPlotOptions(new AreaPlotOptions()
            .setStacking(Stacking.PERCENT)
            .setLineColor("#666666")
            .setLineWidth(1)
            .setMarker(new Marker()
               .setLineWidth(1)
               .setLineColor("#666666")
            )
         )
         .setToolTip(new ToolTip()
         .setFormatter(new ToolTipFormatter() {
            @Override
            public String format(ToolTipData toolTipData) {
               return toolTipData.getXAsString() + ": " +
                  NumberFormat.getFormat("0.0").format(toolTipData.getPercentage()) + "% (" +
                  NumberFormat.getFormat("#,###").format(toolTipData.getYAsDouble()) + " millions)";
            }
         }));

         XAxis xAxis = chart.getXAxis();
         xAxis.setCategories("1750", "1800", "1850", "1900", "1950", "1999", "2050");
         xAxis.setTickmarkPlacement(XAxis.TickmarkPlacement.ON);
         xAxis.setAxisTitleText(null);

         YAxis yAxis = chart.getYAxis();
         yAxis.setAxisTitleText("Billions");
         yAxis.setLabels(new YAxisLabels()
            .setFormatter(new AxisLabelsFormatter() {
               @Override
               public String format(AxisLabelsData axisLabelsData) {
                  return String.valueOf(axisLabelsData.getValueAsLong() / 1000);
               }
            }));

         chart.addSeries(chart.createSeries()
            .setName("Asia")
            .setPoints(new Number[] { 502, 635, 809, 947, 1402, 3634, 5268 })
         );
         chart.addSeries(chart.createSeries()
            .setName("Africa")
            .setPoints(new Number[] { 106, 107, 111, 133, 221, 767, 1766 })
         );
         chart.addSeries(chart.createSeries()
            .setName("Europe")
            .setPoints(new Number[] { 163, 203, 276, 408, 547, 729, 628 })
         );
         chart.addSeries(chart.createSeries()
            .setName("America")
            .setPoints(new Number[] { 18, 31, 54, 156, 339, 818, 1201 })
         );
         chart.addSeries(chart.createSeries()
            .setName("Oceania")
            .setPoints(new Number[] { 2, 2, 2, 6, 13, 30, 46 })
         );
      RootPanel.get().add(chart);
   }
}
Result
Verify the result.
gwt_highcharts_area_charts.htm

Advertisements