- GWT Highcharts - Home
- GWT Highcharts - Overview
- Environment Setup
- Configuration Syntax
- GWT Highcharts - Line Charts
- GWT Highcharts - Area Charts
- GWT Highcharts - Bar Charts
- GWT Highcharts - Column Charts
- GWT Highcharts - Pie Charts
- GWT Highcharts - Scatter Chart
- GWT Highcharts - Dynamic Charts
- GWT Highcharts - Combinations
- GWT Highcharts - 3D Charts
- GWT Highcharts - Map Charts
- GWT Highcharts Useful Resources
- GWT Highcharts - Quick Guide
- GWT Highcharts - Useful Resources
- GWT Highcharts - Discussion
Selected Reading
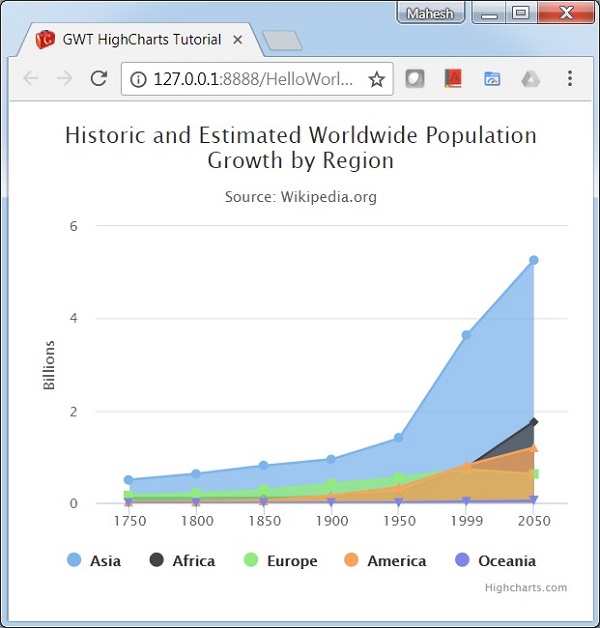
GWT Highcharts - Basic Area Chart
We have already seen the configuration used to draw this chart in Highcharts Configuration Syntax chapter. Let us now consider the following example to further understand a basic area chart.
Example
HelloWorld.java
package com.tutorialspoint.client;

import org.moxieapps.gwt.highcharts.client.Chart;
import org.moxieapps.gwt.highcharts.client.Series.Type;
import org.moxieapps.gwt.highcharts.client.ToolTip;
import org.moxieapps.gwt.highcharts.client.ToolTipData;
import org.moxieapps.gwt.highcharts.client.ToolTipFormatter;
import org.moxieapps.gwt.highcharts.client.XAxis;
import org.moxieapps.gwt.highcharts.client.YAxis;

import org.moxieapps.gwt.highcharts.client.labels.AxisLabelsData;
import org.moxieapps.gwt.highcharts.client.labels.AxisLabelsFormatter;
import org.moxieapps.gwt.highcharts.client.labels.YAxisLabels;

import org.moxieapps.gwt.highcharts.client.plotOptions.AreaPlotOptions;
import org.moxieapps.gwt.highcharts.client.plotOptions.Marker;
import org.moxieapps.gwt.highcharts.client.plotOptions.PlotOptions.Stacking;

import com.google.gwt.core.client.EntryPoint;
import com.google.gwt.i18n.client.NumberFormat;
import com.google.gwt.user.client.ui.RootPanel;

public class HelloWorld implements EntryPoint {
   public void onModuleLoad() {
      Chart chart = new Chart()
         .setType(Type.AREA)
         .setChartTitleText("Historic and Estimated Worldwide Population Growth by Region")
         .setChartSubtitleText("Source: Wikipedia.org")
         .setToolTip(new ToolTip()
         .setFormatter(new ToolTipFormatter() {
            @Override
            public String format(ToolTipData toolTipData) {
               return toolTipData.getXAsString() + ": " +
                  NumberFormat.getFormat("#,###").format(toolTipData.getYAsDouble()) + " millions";
            }
         }));

         XAxis xAxis = chart.getXAxis();
         xAxis.setCategories("1750", "1800", "1850", "1900", "1950", "1999", "2050");
         xAxis.setTickmarkPlacement(XAxis.TickmarkPlacement.ON);
         xAxis.setAxisTitleText(null);

         YAxis yAxis = chart.getYAxis();
         yAxis.setAxisTitleText("Billions");
         yAxis.setLabels(new YAxisLabels()
            .setFormatter(new AxisLabelsFormatter() {
               @Override
               public String format(AxisLabelsData axisLabelsData) {
                  return String.valueOf(axisLabelsData.getValueAsLong() / 1000);
               }
            }));

         chart.addSeries(chart.createSeries()
            .setName("Asia")
            .setPoints(new Number[] { 502, 635, 809, 947, 1402, 3634, 5268 })
         );
         chart.addSeries(chart.createSeries()
            .setName("Africa")
            .setPoints(new Number[] { 106, 107, 111, 133, 221, 767, 1766 })
         );
         chart.addSeries(chart.createSeries()
            .setName("Europe")
            .setPoints(new Number[] { 163, 203, 276, 408, 547, 729, 628 })
         );
         chart.addSeries(chart.createSeries()
            .setName("America")
            .setPoints(new Number[] { 18, 31, 54, 156, 339, 818, 1201 })
         );
         chart.addSeries(chart.createSeries()
            .setName("Oceania")
            .setPoints(new Number[] { 2, 2, 2, 6, 13, 30, 46 })
         );
      RootPanel.get().add(chart);
   }
}
Result
Verify the result.
gwt_highcharts_area_charts.htm

Advertisements