- GWT Highcharts - Home
- GWT Highcharts - Overview
- Environment Setup
- Configuration Syntax
- GWT Highcharts - Line Charts
- GWT Highcharts - Area Charts
- GWT Highcharts - Bar Charts
- GWT Highcharts - Column Charts
- GWT Highcharts - Pie Charts
- GWT Highcharts - Scatter Chart
- GWT Highcharts - Dynamic Charts
- GWT Highcharts - Combinations
- GWT Highcharts - 3D Charts
- GWT Highcharts - Map Charts
- GWT Highcharts Useful Resources
- GWT Highcharts - Quick Guide
- GWT Highcharts - Useful Resources
- GWT Highcharts - Discussion
Selected Reading
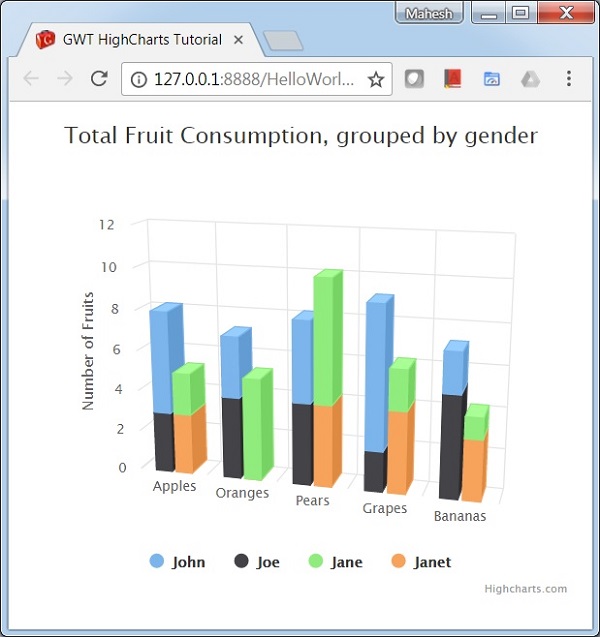
GWT Highcharts - 3D Column Chart
Following is an example of a 3D Column Chart.
We have already seen the configuration used to draw a chart in Highcharts Configuration Syntax chapter.
An example of a 3D Column Chart is given below.
Configurations
Let us now see the additional configurations/steps taken.
option3D
Configure the column chart type to be 3D based. Options3D sets the 3D options enabled.
chart.setOptions3D(new Options3D()
   .setEnabled(true)
   .setAlpha(15)
   .setBeta(15)
   .setViewDistance(25)
   .setDepth(40)
)
Example
HelloWorld.java
package com.tutorialspoint.client;

import org.moxieapps.gwt.highcharts.client.AxisTitle;
import org.moxieapps.gwt.highcharts.client.Chart;
import org.moxieapps.gwt.highcharts.client.Options3D;
import org.moxieapps.gwt.highcharts.client.Series;
import org.moxieapps.gwt.highcharts.client.ToolTip;
import org.moxieapps.gwt.highcharts.client.plotOptions.ColumnPlotOptions;
import org.moxieapps.gwt.highcharts.client.plotOptions.PlotOptions.Stacking;

import com.google.gwt.core.client.EntryPoint;
import com.google.gwt.user.client.ui.RootPanel;

public class HelloWorld implements EntryPoint {
   public void onModuleLoad() {
      final Chart chart = new Chart()
         .setType(Series.Type.COLUMN)
         .setOptions3D(new Options3D()
            .setEnabled(true)
            .setAlpha(15)
            .setBeta(15)
            .setViewDistance(25)
            .setDepth(40)
         )
         .setMarginTop(80)
         .setMarginRight(40)
         .setChartTitleText("Total Fruit Consumption, grouped by gender");

      chart.getXAxis()
         .setCategories("Apples", "Oranges", "Pears", "Grapes", "Bananas");

      chart.getYAxis()
         .setAllowDecimals(false)
         .setMin(0)
         .setAxisTitle(new AxisTitle()
            .setText("Number of Fruits")
         );

      chart.setToolTip(new ToolTip()
        .setHeaderFormat("<b>{point.key}</b><br>")
        .setPointFormat("<span style=\"color:{series.color}\">\\u25CF</span> {series.name}: {point.y} / {point.stackTotal}")
      );

      chart.setColumnPlotOptions(new ColumnPlotOptions()
        .setStacking(Stacking.NORMAL)
        .setDepth(40)
      );

      chart.addSeries(chart.createSeries()
         .setName("John")
         .setStack("male")
         .setPoints(new Number[] {5, 3, 4, 7, 2})
      )
      .addSeries(chart.createSeries()
         .setName("Joe")
         .setStack("male")
         .setPoints(new Number[] {3, 4, 4, 2, 5})
      )
      .addSeries(chart.createSeries()
         .setName("Jane")
         .setStack("female")
         .setPoints(new Number[] {2, 5, 6, 2, 1})
      )
      .addSeries(chart.createSeries()
         .setName("Janet")
         .setStack("female")
         .setPoints(new Number[] {3, 0, 4, 4, 3})
      );
      RootPanel.get().add(chart);
   }
}
Result
Verify the result.
gwt_highcharts_3d_charts.htm

Advertisements