- GWT Google Charts - Home
- GWT Google Charts - Overview
- Environment Setup
- Configuration Syntax
- GWT Google Charts - Area Charts
- GWT Google Charts - Bar Charts
- GWT Google Charts - Bubble Charts
- GWT Google Charts - Candlestick
- GWT Google Charts - Column Charts
- GWT Google Charts - Combination
- GWT Google Charts - Histogram
- GWT Google Charts - Line Charts
- GWT Google Charts - Maps
- GWT Google Charts - Organization
- GWT Google Charts - Pie Charts
- GWT Google Charts - Sankey Charts
- GWT Google Charts - Scatter Chart
- GWT Google Charts - Stepped Area
- GWT Google Charts - Table Chart
- GWT Google Charts - TreeMap Chart
- GWT Google Charts Resources
- GWT Google Charts - Quick Guide
- GWT Google Charts - Resources
- GWT Google Charts - Discussion
Selected Reading
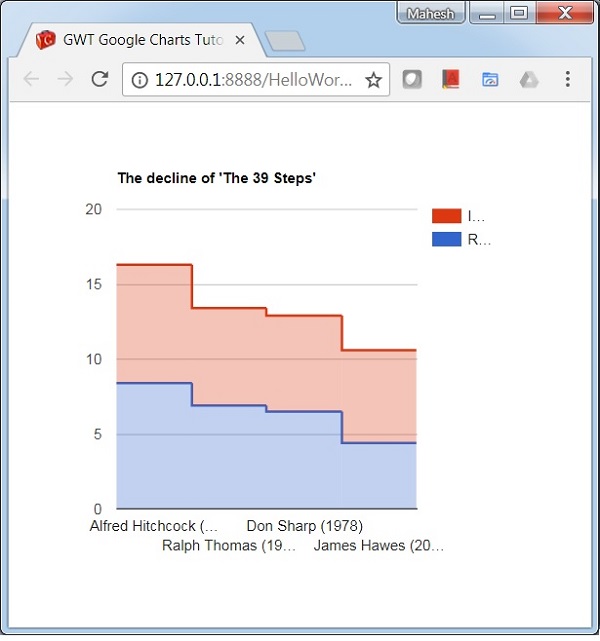
GWT Google Charts - Stacked Stepped Chart
Following is an example of a Stacked Stepped Chart.
We have already seen the configurations used to draw a chart in Google Charts Configuration Syntax chapter. Now, let us see an example of a Stacked Stepped Chart.
Configurations
We've used isStacked configuration to show a Stepped chart as stacked.
options.setIsStacked(true);
Example
HelloWorld.java
package com.tutorialspoint.client;

import com.google.gwt.core.client.EntryPoint;
import com.google.gwt.user.client.ui.RootPanel;

import com.googlecode.gwt.charts.client.ChartLoader;
import com.googlecode.gwt.charts.client.ChartPackage;
import com.googlecode.gwt.charts.client.ColumnType;
import com.googlecode.gwt.charts.client.DataTable;
import com.googlecode.gwt.charts.client.corechart.SteppedAreaChart;
import com.googlecode.gwt.charts.client.corechart.SteppedAreaChartOptions;
import com.googlecode.gwt.charts.client.options.VAxis;

public class HelloWorld implements EntryPoint {
   private SteppedAreaChart chart;

   private void initialize() {
      ChartLoader chartLoader = new ChartLoader(ChartPackage.CORECHART);
      chartLoader.loadApi(new Runnable() {
         public void run() {
            // Create and attach the chart
            chart = new SteppedAreaChart();
            RootPanel.get().add(chart);
            draw();
         }
      });
   }
   private void draw() {
      // Prepare the data
      DataTable data = DataTable.create();
      data.addColumn(ColumnType.STRING, "Director (Year)");
      data.addColumn(ColumnType.NUMBER, "Rotten Tomatoes");
      data.addColumn(ColumnType.NUMBER, "IMDB");

      data.addRow("Alfred Hitchcock (1935)", 8.4, 7.9);
      data.addRow("Ralph Thomas (1959)",     6.9,         6.5);
      data.addRow("Don Sharp (1978)",        6.5,         6.4);
      data.addRow("James Hawes (2008)",      4.4,         6.2);

      SteppedAreaChartOptions options  = SteppedAreaChartOptions.create();
      options.setTitle("The decline of 'The 39 Steps'");
      options.setIsStacked(true);
      VAxis vAxis = VAxis.create();
      vAxis.setTitle("Accumulated Rating");

      // Draw the chart
      chart.draw(data, options);
      chart.setWidth("400px");
      chart.setHeight("400px");
   }
   public void onModuleLoad() {
      initialize();
   }
}
Result
Verify the result.
gwt_googlecharts_stepped_charts.htm

Advertisements