- GWT Google Charts - Home
- GWT Google Charts - Overview
- Environment Setup
- Configuration Syntax
- GWT Google Charts - Area Charts
- GWT Google Charts - Bar Charts
- GWT Google Charts - Bubble Charts
- GWT Google Charts - Candlestick
- GWT Google Charts - Column Charts
- GWT Google Charts - Combination
- GWT Google Charts - Histogram
- GWT Google Charts - Line Charts
- GWT Google Charts - Maps
- GWT Google Charts - Organization
- GWT Google Charts - Pie Charts
- GWT Google Charts - Sankey Charts
- GWT Google Charts - Scatter Chart
- GWT Google Charts - Stepped Area
- GWT Google Charts - Table Chart
- GWT Google Charts - TreeMap Chart
- GWT Google Charts Resources
- GWT Google Charts - Quick Guide
- GWT Google Charts - Resources
- GWT Google Charts - Discussion
Selected Reading
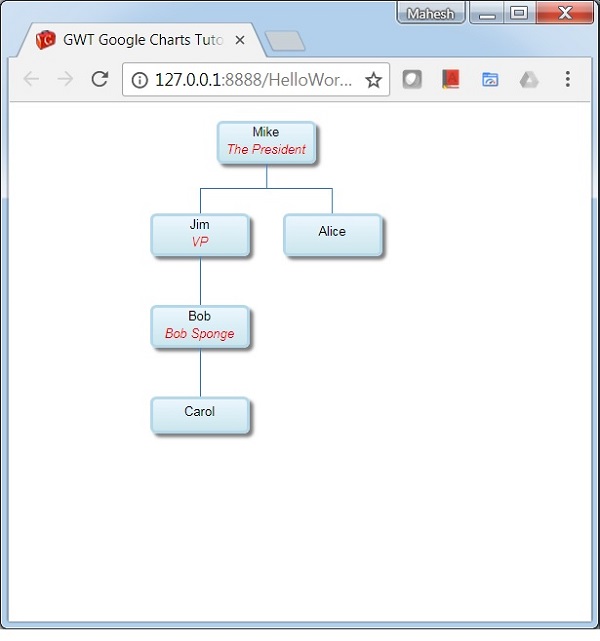
GWT Google Charts - Organization Chart
Following is an example of a Organization Chart.
Organization chart helps in rendering a hierarchy of nodes, used to portray superior/subordinate relationships in an organization. For example, A family tree is a type of org chart. We have already seen the configurations used to draw a chart in Google Charts Configuration Syntax chapter. Now, let us see an example of a Organization Chart.
Configurations
We've used OrgChart class to show a Organization Chart.
// Organization chart
OrgChart chart = new OrgChart();
Example
HelloWorld.java
package com.tutorialspoint.client;

import com.google.gwt.core.client.EntryPoint;
import com.google.gwt.user.client.ui.RootPanel;

import com.googlecode.gwt.charts.client.ChartLoader;
import com.googlecode.gwt.charts.client.ChartPackage;
import com.googlecode.gwt.charts.client.ColumnType;
import com.googlecode.gwt.charts.client.DataTable;
import com.googlecode.gwt.charts.client.format.PatternFormat;
import com.googlecode.gwt.charts.client.orgchart.OrgChart;
import com.googlecode.gwt.charts.client.orgchart.OrgChartOptions;

public class HelloWorld implements EntryPoint {
   private OrgChart chart;

   private void initialize() {
      ChartLoader chartLoader = new ChartLoader(ChartPackage.ORGCHART);
      chartLoader.loadApi(new Runnable() {
         public void run() {
            // Create and attach the chart
            chart = new OrgChart();
            RootPanel.get().add(chart);
            draw();
         }
      });
   }
   private void draw() {
      // Prepare the data
      DataTable dataTable = DataTable.create();
      dataTable.addColumn(ColumnType.STRING, "Name");
      dataTable.addColumn(ColumnType.STRING, "Manager");
      dataTable.addColumn(ColumnType.STRING, "ToolTip");
      dataTable.addRows(5);

      dataTable.setValue(0, 0, "Mike");
      dataTable.setValue(0, 1, "");
      dataTable.setValue(0, 2, "The President");
      dataTable.setValue(1, 0, "Jim");
      dataTable.setValue(1, 1, "Mike");
      dataTable.setValue(1, 2, "VP");
      dataTable.setValue(2, 0, "Alice");
      dataTable.setValue(2, 1, "Mike");
      dataTable.setValue(2, 2, "");
      dataTable.setValue(3, 0, "Bob");
      dataTable.setValue(3, 1, "Jim");
      dataTable.setValue(3, 2, "Bob Sponge");
      dataTable.setValue(4, 0, "Carol");
      dataTable.setValue(4, 1, "Bob");
      dataTable.setValue(4, 2, "");

      PatternFormat format = PatternFormat.create("{0} {1}");
      format.format(dataTable, 0, 2);

      // Set options
      OrgChartOptions options = OrgChartOptions.create();
      options.setAllowHtml(true);

      // Draw the chart
      chart.draw(dataTable, options);
      chart.setWidth("400px");
      chart.setHeight("400px");
   }
   public void onModuleLoad() {
      initialize();
   }
}
Result
Verify the result.

Advertisements