- GWT Google Charts - Home
- GWT Google Charts - Overview
- Environment Setup
- Configuration Syntax
- GWT Google Charts - Area Charts
- GWT Google Charts - Bar Charts
- GWT Google Charts - Bubble Charts
- GWT Google Charts - Candlestick
- GWT Google Charts - Column Charts
- GWT Google Charts - Combination
- GWT Google Charts - Histogram
- GWT Google Charts - Line Charts
- GWT Google Charts - Maps
- GWT Google Charts - Organization
- GWT Google Charts - Pie Charts
- GWT Google Charts - Sankey Charts
- GWT Google Charts - Scatter Chart
- GWT Google Charts - Stepped Area
- GWT Google Charts - Table Chart
- GWT Google Charts - TreeMap Chart
- GWT Google Charts Resources
- GWT Google Charts - Quick Guide
- GWT Google Charts - Resources
- GWT Google Charts - Discussion
GWT Google Charts - Configuration Syntax
In this chapter, we will showcase the configuration required to draw a chart using the Google Charts API in GWT.
Step 1: Create GWT Application
Follow the following steps to update the GWT application we created in GWT - Create Application chapter −
| Step | Description |
|---|---|
| 1 | Create a project with a name HelloWorld under a package com.tutorialspoint as explained in the GWT - Create Application chapter. |
| 2 | Modify HelloWorld.gwt.xml, HelloWorld.html and HelloWorld.java as explained below. Keep rest of the files unchanged. |
| 3 | Compile and run the application to verify the result of the implemented logic. |
Following is the content of the modified module descriptor src/com.tutorialspoint/HelloWorld.gwt.xml.
<?xml version = "1.0" encoding = "UTF-8"?>
<module rename-to = 'helloworld'>
   <inherits name = 'com.google.gwt.user.User'/>
   <inherits name = 'com.google.gwt.user.theme.clean.Clean'/>
   <entry-point class = 'com.tutorialspoint.client.HelloWorld'/>
   <inherits name="com.googlecode.gwt.charts.Charts"/>
   <source path = 'client'/>
   <source path = 'shared'/>
</module>
Following is the content of the modified HTML host file war/HelloWorld.html.
<html>
   <head>
      <title>GWT Highcharts Showcase</title>
      <link rel = "stylesheet" href = "HelloWorld.css"/>
      <script language = "javascript" src = "helloworld/helloworld.nocache.js">
   </head>
   <body>
   </body>
</html>
We'll see the updated HelloWorld.java in the end after understanding configurations.
Step 2: Create Configurations
Load Library and create chart
Load the library using ChartLoader and then create the chart.
ChartLoader chartLoader = new ChartLoader(ChartPackage.CORECHART);
chartLoader.loadApi(new Runnable() {
   public void run() {
      // Create and attach the chart
      PieChart chart = new PieChart();
   }
});
DataTable
Configure the details by creating a data table.
// Prepare the data
DataTable data = DataTable.create();
data.addColumn(ColumnType.STRING, "Browser");
data.addColumn(ColumnType.NUMBER, "Percentage");
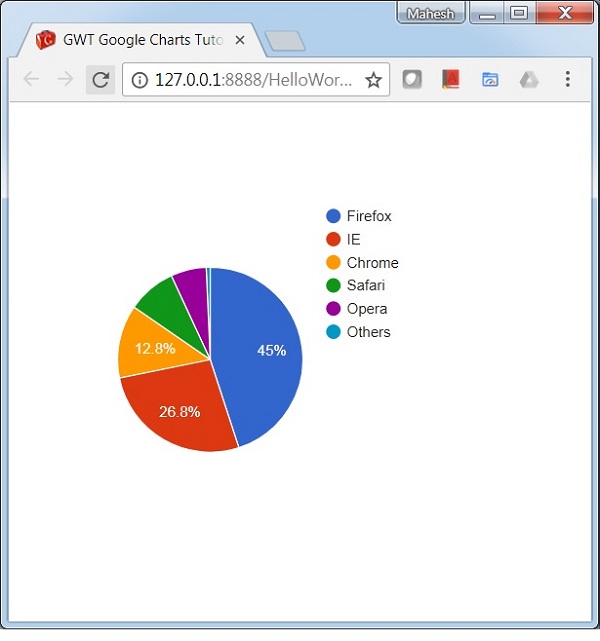
data.addRow("Firefox", 45.0);
data.addRow("IE", 26.8);
data.addRow("Chrome", 12.8);
data.addRow("Safari", 8.5);
data.addRow("Opera", 6.2);
data.addRow("Others", 0.7);
// Draw the chart
chart.draw(data);
Size
Configure the width and height to be set.
chart.setWidth("700px");
chart.setHeight("700px");
Step 3: Add the chart to parent panel.
We're adding the chart to root panel.
RootPanel.get().add(chart);
Example
Consider the following example to further understand the Configuration Syntax −
HelloWorld.java
package com.tutorialspoint.client;

import com.google.gwt.core.client.EntryPoint;
import com.google.gwt.user.client.ui.RootPanel;
import com.googlecode.gwt.charts.client.ChartLoader;
import com.googlecode.gwt.charts.client.ChartPackage;
import com.googlecode.gwt.charts.client.ColumnType;
import com.googlecode.gwt.charts.client.DataTable;
import com.googlecode.gwt.charts.client.corechart.PieChart;

public class HelloWorld implements EntryPoint {
   private PieChart chart;

   private void initialize() {
      ChartLoader chartLoader = new ChartLoader(ChartPackage.CORECHART);
      chartLoader.loadApi(new Runnable() {
         public void run() {
            // Create and attach the chart
            chart = new PieChart();
            RootPanel.get().add(chart);
            draw();
         }
      });
   }
   private void draw() {
      // Prepare the data
      DataTable data = DataTable.create();
      data.addColumn(ColumnType.STRING, "Browser");
      data.addColumn(ColumnType.NUMBER, "Percentage");
      data.addRow("Firefox", 45.0);
      data.addRow("IE", 26.8);
      data.addRow("Chrome", 12.8);
      data.addRow("Safari", 8.5);
      data.addRow("Opera", 6.2);
      data.addRow("Others", 0.7);

      // Draw the chart
      chart.draw(data);
      chart.setWidth("400px");
      chart.setHeight("400px");
   }
   public void onModuleLoad() {
      initialize();
   }
}
Result
Verify the result.