- GWT Google Charts - Home
- GWT Google Charts - Overview
- Environment Setup
- Configuration Syntax
- GWT Google Charts - Area Charts
- GWT Google Charts - Bar Charts
- GWT Google Charts - Bubble Charts
- GWT Google Charts - Candlestick
- GWT Google Charts - Column Charts
- GWT Google Charts - Combination
- GWT Google Charts - Histogram
- GWT Google Charts - Line Charts
- GWT Google Charts - Maps
- GWT Google Charts - Organization
- GWT Google Charts - Pie Charts
- GWT Google Charts - Sankey Charts
- GWT Google Charts - Scatter Chart
- GWT Google Charts - Stepped Area
- GWT Google Charts - Table Chart
- GWT Google Charts - TreeMap Chart
- GWT Google Charts Resources
- GWT Google Charts - Quick Guide
- GWT Google Charts - Resources
- GWT Google Charts - Discussion
Selected Reading
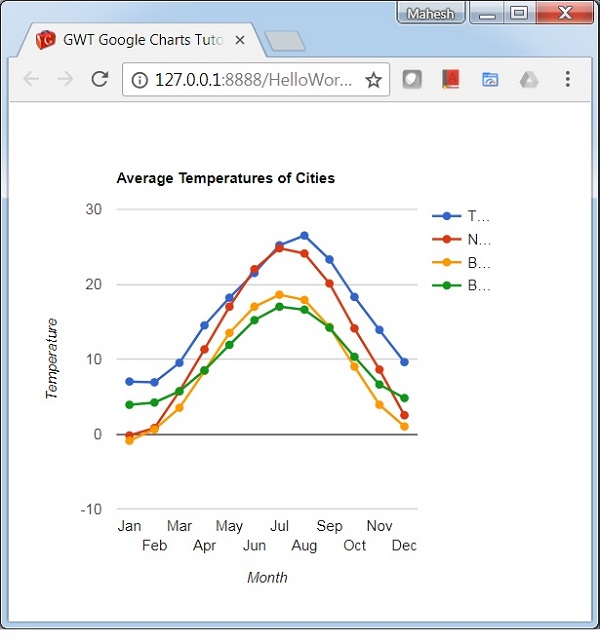
Line Chart with visibile points
Following is an example of a Basic Line Chart with visibile points.
We have already seen the configurations used to draw a chart in Google Charts Configuration Syntax chapter. Now, let us see an example of a basic line chart with visibile points.
Configurations
We've used pointSize configuration to change size of points. Default is 0.
options.setPointSize(5);
Example
HelloWorld.java
package com.tutorialspoint.client;

import com.google.gwt.core.client.EntryPoint;
import com.google.gwt.user.client.ui.RootPanel;

import com.googlecode.gwt.charts.client.ChartLoader;
import com.googlecode.gwt.charts.client.ChartPackage;
import com.googlecode.gwt.charts.client.ColumnType;
import com.googlecode.gwt.charts.client.DataTable;
import com.googlecode.gwt.charts.client.corechart.LineChart;
import com.googlecode.gwt.charts.client.corechart.LineChartOptions;
import com.googlecode.gwt.charts.client.options.HAxis;
import com.googlecode.gwt.charts.client.options.VAxis;

public class HelloWorld implements EntryPoint {
   private LineChart chart;

   private void initialize() {
      ChartLoader chartLoader = new ChartLoader(ChartPackage.CORECHART);
      chartLoader.loadApi(new Runnable() {
         public void run() {
            // Create and attach the chart
            chart = new LineChart();
            RootPanel.get().add(chart);
            draw();
         }
      });
   }
   private void draw() {
      // Prepare the data
      DataTable data = DataTable.create();
      data.addColumn(ColumnType.STRING, "Month");
      data.addColumn(ColumnType.NUMBER, "Tokyo");
      data.addColumn(ColumnType.NUMBER, "New York");
      data.addColumn(ColumnType.NUMBER, "Berlin");
      data.addColumn(ColumnType.NUMBER, "Berlin");

      data.addRow("Jan",  7.0, -0.2, -0.9, 3.9);
      data.addRow("Feb",  6.9, 0.8, 0.6, 4.2);
      data.addRow("Mar",  9.5,  5.7, 3.5, 5.7);
      data.addRow("Apr",  14.5, 11.3, 8.4, 8.5);
      data.addRow("May",  18.2, 17.0, 13.5, 11.9);
      data.addRow("Jun",  21.5, 22.0, 17.0, 15.2);
      data.addRow("Jul",  25.2, 24.8, 18.6, 17.0);
      data.addRow("Aug",  26.5, 24.1, 17.9, 16.6);
      data.addRow("Sep",  23.3, 20.1, 14.3, 14.2);
      data.addRow("Oct",  18.3, 14.1, 9.0, 10.3);
      data.addRow("Nov",  13.9,  8.6, 3.9, 6.6);
      data.addRow("Dec",  9.6,  2.5,  1.0, 4.8);

      // Set options
      LineChartOptions options = LineChartOptions.create();
      options.setTitle("Average Temperatures of Cities");
      options.setHAxis(HAxis.create("Month"));
      options.setVAxis(VAxis.create("Temperature"));
      options.setPointSize(5);

      // Draw the chart
      chart.draw(data,options);
      chart.setWidth("400px");
      chart.setHeight("400px");
   }

   public void onModuleLoad() {
      initialize();
   }
}
Result
Verify the result.
gwt_googlecharts_line_charts.htm

Advertisements