- GWT Google Charts - Home
- GWT Google Charts - Overview
- Environment Setup
- Configuration Syntax
- GWT Google Charts - Area Charts
- GWT Google Charts - Bar Charts
- GWT Google Charts - Bubble Charts
- GWT Google Charts - Candlestick
- GWT Google Charts - Column Charts
- GWT Google Charts - Combination
- GWT Google Charts - Histogram
- GWT Google Charts - Line Charts
- GWT Google Charts - Maps
- GWT Google Charts - Organization
- GWT Google Charts - Pie Charts
- GWT Google Charts - Sankey Charts
- GWT Google Charts - Scatter Chart
- GWT Google Charts - Stepped Area
- GWT Google Charts - Table Chart
- GWT Google Charts - TreeMap Chart
- GWT Google Charts Resources
- GWT Google Charts - Quick Guide
- GWT Google Charts - Resources
- GWT Google Charts - Discussion
Selected Reading
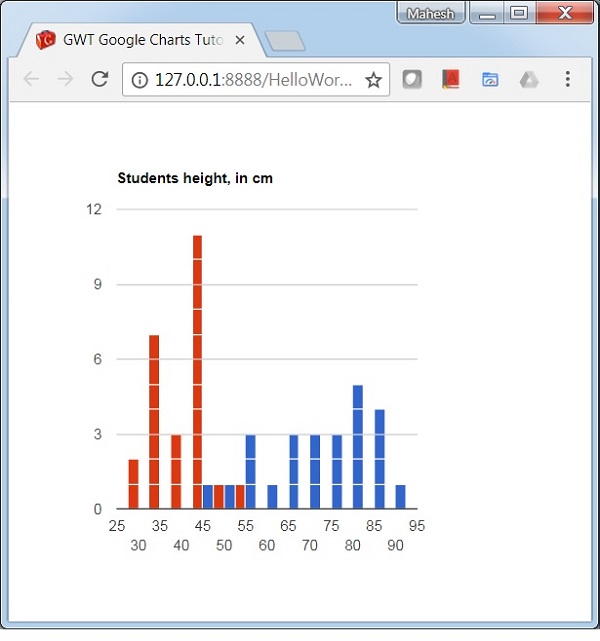
Histogram Chart with multiple series
Following is an example of a Histogram Chart with multiple series.
We have already seen the configurations used to draw a chart in Google Charts Configuration Syntax chapter. Now, let us see an example of a histogram chart with multiple series.
Example
HelloWorld.java
package com.tutorialspoint.client;

import com.google.gwt.core.client.EntryPoint;
import com.google.gwt.user.client.ui.RootPanel;

import com.googlecode.gwt.charts.client.ChartLoader;
import com.googlecode.gwt.charts.client.ChartPackage;
import com.googlecode.gwt.charts.client.DataTable;
import com.googlecode.gwt.charts.client.corechart.Histogram;
import com.googlecode.gwt.charts.client.corechart.HistogramOptions;
import com.googlecode.gwt.charts.client.options.Legend;
import com.googlecode.gwt.charts.client.options.LegendPosition;
import com.googlecode.gwt.charts.client.util.ChartHelper;

public class HelloWorld implements EntryPoint {
   private Histogram chart;

   private void initialize() {
      ChartLoader chartLoader = new ChartLoader(ChartPackage.CORECHART);
      chartLoader.loadApi(new Runnable() {
         public void run() {
            // Create and attach the chart
            chart = new Histogram();
            RootPanel.get().add(chart);
            draw();
         }
      });
   }
   private void draw() {
      // Prepare the data
      Object[][] data = new Object[][] { { "Student Roll No", "Height", "Weight" },
         {"1", 80, 40},{"2", 55, 30},{"3", 68, 34},{"4", 80, 40},{"5", 54, 27},
         {"6", 70, 35},{"7", 85, 42},{"8", 78, 40},{"9", 70, 35},{"10", 58, 28},
         {"11", 90, 45},{"12", 65, 33},{"13", 88, 50},{"14", 82, 41},{"15", 65, 30},
         {"16", 86, 43},{"17", 45, 30},{"18", 62, 30},{"19", 84, 42},{"20", 75, 40},
         {"21", 82, 41},{"22", 75, 40},{"23", 58, 30},{"24", 70, 35},{"25", 85, 40}
      };
      DataTable dataTable = ChartHelper.arrayToDataTable(data);

      // Set options
      HistogramOptions options = HistogramOptions.create();
      options.setTitle("Students height, in cm");
      options.setLegend(Legend.create(LegendPosition.NONE));
      options.setBucketSize(5);

      // Draw the chart
      chart.draw(dataTable,options);
      chart.setWidth("400px");
      chart.setHeight("400px");
   }
   public void onModuleLoad() {
      initialize();
   }
}
Result
Verify the result.
gwt_googlecharts_histogram_charts.htm

Advertisements