- Cypress - Home
- Cypress - Introduction
- Cypress - Architecture and Environment Setup
- Cypress - Test Runner
- Cypress - Build First Test
- Cypress - Supported Browsers
- Cypress - Basic Commands
- Cypress - Variables
- Cypress - Aliases
- Cypress - Locators
- Cypress - Assertions
- Cypress - Text Verification
- Cypress - Asynchronous Behavior
- Cypress - Working with XHR
- Cypress - jQuery
- Cypress - Checkbox
- Cypress - Tabs
- Cypress - Dropdown
- Cypress - Alerts
- Cypress - Child Windows
- Cypress - Hidden Elements
- Cypress - Frames
- Cypress - Web Tables
- Cypress - Mouse Actions
- Cypress - Cookies
- Cypress - Get and Post
- Cypress - File Upload
- Cypress - Data Driven Testing
- Cypress - Prompt Pop-up Window
- Cypress - Dashboards
- Cypress - Screenshots and Videos
- Cypress - Debugging
- Cypress - Custom Commands
- Cypress - Fixtures
- Cypress - Environment Variables
- Cypress - Hooks
- Cypress - Configuration of JSON File
- Cypress - Reports
- Cypress - Plugins
- Cypress - GitHub
- Cypress Useful Resources
- Cypress - Quick Guide
- Cypress - Useful Resources
- Cypress - Discussion
Cypress - Dashboards
Cypress Dashboard Service has to be set up to create a link between Cypress tests running in our system and the dashboard which is hosted on the cloud.
Features
The features of Cypress Dashboard are explained below −
It provides data on the total number of passed, failed and skipped test cases.
The stack trace and screenshots of the failed tests are available.
The video of test execution is available.
Management of test data, framework and their access is possible.
The usage trends in the organization is provided.
Setup Cypress Dashboard
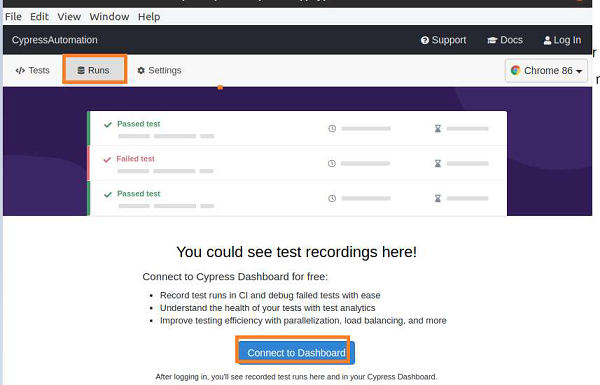
To set up the process, first, we should go to the Runs tab in the Cypress Test Runner window. Then, click on Connect to Dashboard. The following screen will appear −
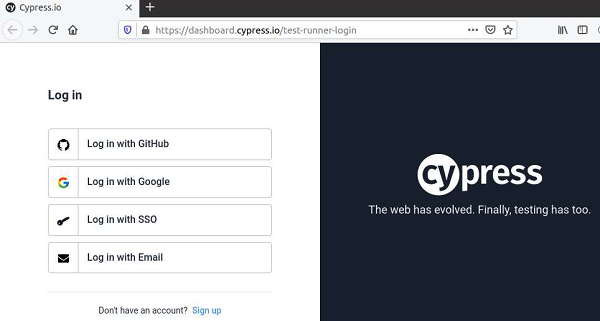
We shall get various options of logging on to the Dashboard, as shown below −
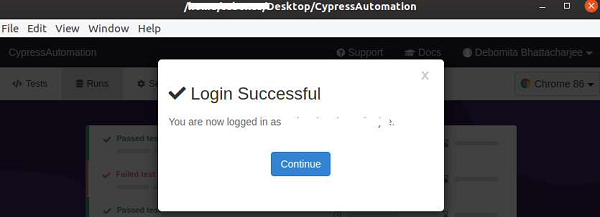
After successful sign in, we shall get the success message. Click on Continue.
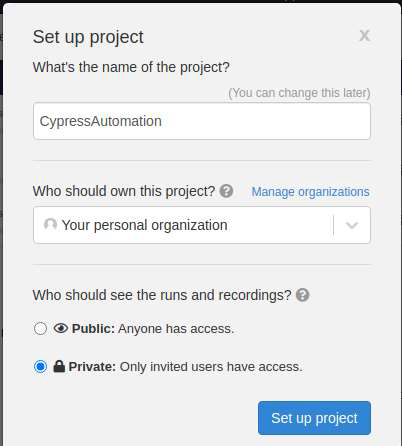
Enter the project name, owner and users, who can see the project.
Then, click on Set up project.
Cypress shall then give the following suggestions −
project Id
unique project key (in form of command to be executed in terminal)
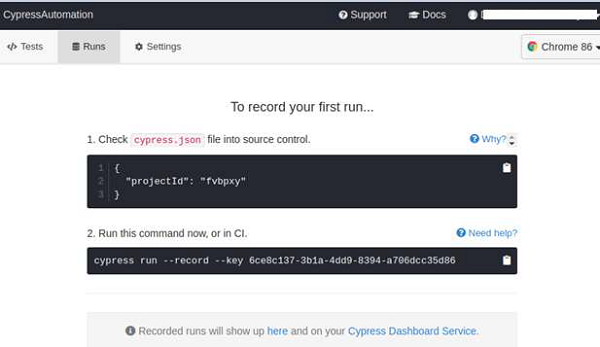
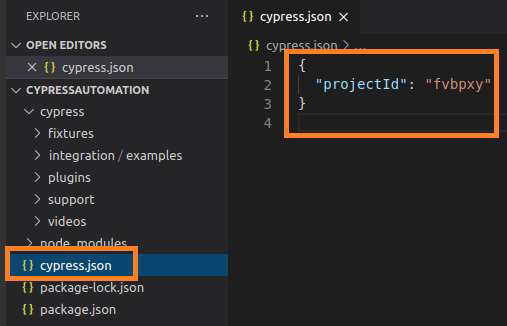
The projectId obtained from the Cypress suggestion should match with the project id available in the cypress.json file within the project folder.
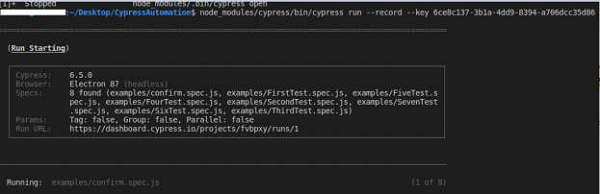
Next, we have to run the below mentioned command as suggested by Cypress −
node_modules/cypress/bin/cypress run --record --key <project key>
The screen given below will appear −
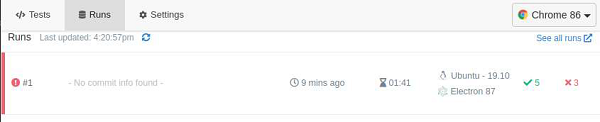
Once the execution is done, we have to open the Runs tab of the Test Runner. It has the information on platform, browser, and duration of the tests.
The test records shall be visible. Click on a record.
The record is opened in a browser, with the test result Overview (count of passed, failed, pending, skipped), as shown below.
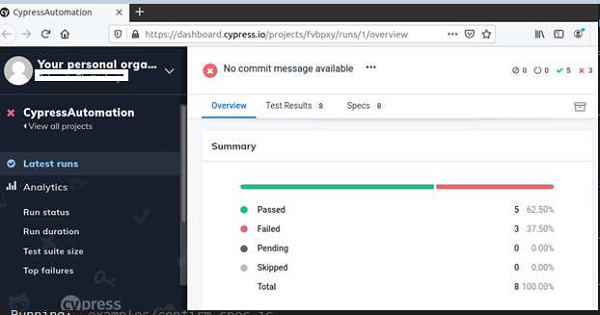
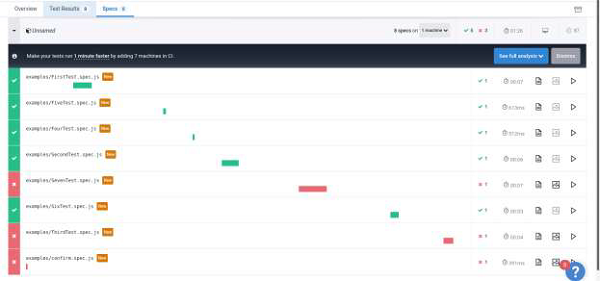
In the Specs tab, we should have the details of each test and its result.
Additionally, there are features like output, failed test screenshot, videos, and so on.