
Article Categories
- All Categories
-
 Data Structure
-
 Networking
-
 RDBMS
RDBMS
-
 Operating System
-
 Java
Java
-
 MS Excel
-
 iOS
iOS
-
 HTML
HTML
-
 CSS
CSS
-
 Android
-
 Python
-
 C Programming
-
 C++
C++
-
 C#
C#
-
 MongoDB
-
 MySQL
MySQL
-
 Javascript
-
 PHP
PHP
-
 Economics & Finance
Selected Reading
Comparing 'cubic' and 'linear' 1-D interpolation using SciPy library
Below python script will compare the ‘cubic’ and ‘linear’ interpolation on same data using SciPy library −
Example
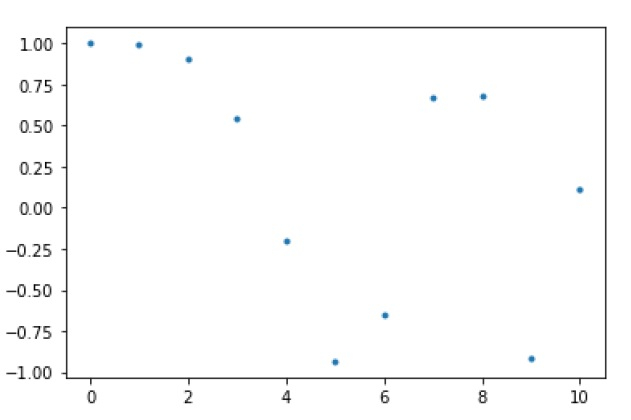
First let’s generate some data to implement interpolation on that −
import numpy as np
from scipy.interpolate import interp1d
import matplotlib.pyplot as plt
A = np.linspace(0, 10, num=11, endpoint=True)
B = np.cos(-A**2/9.0)
print (A, B)
Output
The above script will generate the following points between 0 and 4 −
[ 0. 1. 2. 3. 4. 5. 6. 7. 8. 9. 10.] [ 1. 0.99383351 0.90284967 0.54030231 -0.20550672 -0.93454613 -0.65364362 0.6683999 0.67640492 -0.91113026 0.11527995]
Now, let’s plot these points as follows −
plt.plot(A, B, '.')
plt.show()
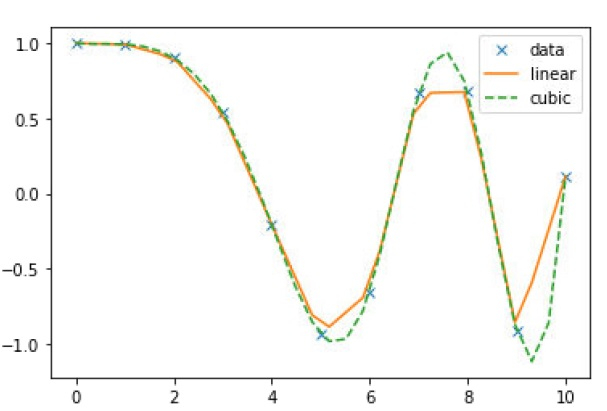
Now, based on fixed data points, we need to create two interpolate functions-one for ‘linear’ and other for ‘cubic’. Let’s create it −
function_interpolate1 = interp1d(A, B, kind = 'linear')
function_interpolate2 = interp1d(A, B, kind = 'cubic')
To see the clear difference in both interpolations, we will create a new input of more length by using the same function as used for old input −
Anew = np.linspace(0, 10, num=30, endpoint=True)
plt.plot(A, B, 'x', Anew, function_interpolate1(Anew), '-',
Anew,function_interpolate2(Anew), '--')
plt.legend(['data', 'linear', 'cubic'], loc = 'best')
plt.show()

Updated on: 2021-11-24T11:08:27+05:30
421 Views

Advertisements