
Article Categories
- All Categories
-
 Data Structure
-
 Networking
-
 RDBMS
RDBMS
-
 Operating System
-
 Java
Java
-
 MS Excel
-
 iOS
iOS
-
 HTML
HTML
-
 CSS
CSS
-
 Android
-
 Python
-
 C Programming
-
 C++
C++
-
 C#
C#
-
 MongoDB
-
 MySQL
MySQL
-
 Javascript
-
 PHP
PHP
-
 Economics & Finance
Selected Reading
Change x axes scale in matplotlib
Using plt.xticks, we can change the X-axis scale.
Steps
Using plt.plot() method, we can create a line with two lists that are passed in its argument.
Add text to the axes. Add the text *s* to the axes at location *x*, *y* in data coordinates, using plt.text() method, where the font size can be customized by changing the font-size value.
Using xticks method, get or set the current tick locations and labels of the X-axis.
To show the figure, use plt.show() method.
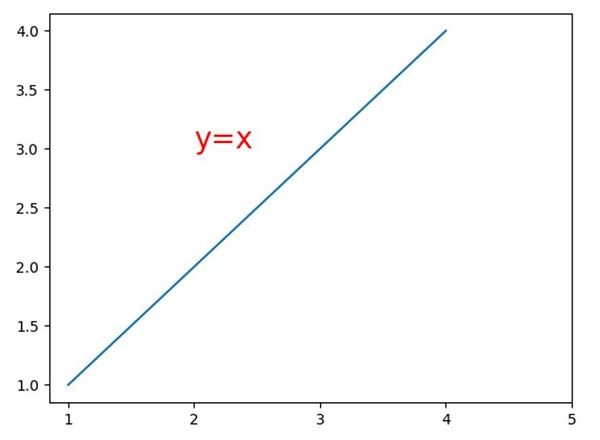
Example
import matplotlib.pyplot as plt

plt.plot([1, 2, 4], [1, 2, 4])

plt.text(2, 3, "y=x", color='red', fontsize=20)

plt.xticks([1, 2, 3, 4, 5])    # changing x scale by own

plt.show()
Output

Updated on: 2021-03-15T08:44:15+05:30
15K+ Views

Advertisements