- BI - Introduction
- BI - History
- BI - Main Uses
- BI - Concepts
- BI - Architecture
- BI - Types
- BI - Implementations
- BI - Applications
- BI - Examples
- BI - Phases
- BI - Teams and Roles
- BI - Financials
- IBI - Introduction
Business Intelligence - Quick Guide
Business Intelligence - Introduction
Business Intelligence is a collection of procedures, mechanisms, and technologies that modify raw data into significant information that drives cost-effective business services. It is a collection of software and services to modify data into actionable intelligence and recognition.
BI has a huge impact on an organizations methods and tactical and operational business decisions. BI supports fact-based decision-making using historical data rather than assumptions and gut feelings.
BI tools implement data analysis and make documents, summaries, dashboards, maps, graphs, and charts to support users with detailed intelligence about the features of the business.
Business Intelligence is one of the most dynamic tools many organizations use to know their user base and industry better. It defines the business methodology in which the raw information is transformed into useful data which support decision-making.
Business intelligence has wide software, and if talking about the advantage of business intelligence in the retail sector, current business intelligence tools allow organizations to take benefit of information not only to consider current sales but also to estimate future potential, patterns, trends, and understand the demand of the user on a deeper level.
BI helps make data easily accessible and understandable for decision-makers so they can make informed choices. This ongoing process is designed to be efficient and scalable, ensuring businesses have the insights they need to improve performance and achieve their goals.
BI was created to help businesses overcome the issue of "garbage in, garbage out," which occurs when data analysis is based on inaccurate or incomplete information.
Business Intelligence Objective
The main objective of business intelligence is to make Business work effectively by ensuring that information is easy to access, understand, and secure. Start by using intuitive tools that present accurate and up-to-date data clearly, so users can make better decisions. Data should come from reliable sources and be accessible only to those who need it.
Traditional BI Vs Modern BI
Heres a comparison to highlight their key differences −
| Traditional BI | Modern BI |
|---|---|
| Traditional BI often depended on IT teams to access data, which made it harder for business users to get the results they needed. | Modern BI makes it easy for business users by giving them access to data and the tools they need, especially AI tools, to quickly achieve the desired results. |
| Traditional BI, business users often had to wait for reports, which could mean the information was outdated by the time they received it. | With modern BI, business users can access accurate, up-to-date information whenever they need it. |
| Traditional BI is time-consuming and involves delays. | Modern BI allows quick access to data. |
| Traditional BI often results in inconsistent data usage, which can create confusion and errors. | Modern BI ensures consistent data use, so everyone has access to the same reliable information. |
| Traditional BI platforms mostly focused on giving users detailed historical reports and user-friendly ad-hoc analysis tools. | Modern BI focuses on real-time data analysis and advanced tools for in-depth insights and predictive analytics. |
| Traditional BI often required access from specific locations or devices, making it harder to get data on the go. | Modern BI makes it easy for your team to access data and insights from anywhere, on any device. |
Methods of Business Intelligence
The methods of business intelligence are as follows −
1. Data analysis visualization
Data analysis visualization is all about how it visualizes the data. It presents records on dashboards and uses customized metrics associated with the business to create better decisions based on facts.
2. Reporting
Business intelligence tools are used for reporting information gathering from all the sources and processing it to enable better reporting and financial decision-making with a rational mind.
3. Predictive Analytics
Predictive analytics is how you learn an action will work. The fact is you don't learn, and if you learn not 100 percent. However, with business intelligence, it can make an evidence-based decision to drive business further. Business intelligence allows us to create a reasonable prediction of the current trends and user behaviors that impact the organization's complete development.
4. Data Mining
Data mining is a computer-supported technique to reveal previously anonymous or unnoticed relations between data entities. Data mining is the procedure of discovering useful new correlations, designs, and trends by sharing a high amount of data saved in the warehouse, using pattern recognition technologies such as statistical and numerical approaches.
Types of BI Tools and Software
BI tools are software programs that help in gathering, processing, and analyzing a large amount of data from different sources and these software turns these data into valuable information, making it easier for businesses to understand and use the data for decision-making.
Below are different BI software and solutions −
Spreadsheets − In this software, the user inputs, stores, edits, organizes, computes, and visualizes data.
Examples − MS Excel, Google Sheets, etc.
- OLAP − OLAP stands for Online Analytical Processing. OLAP solutions allow users to view and analyze data from different perspectives by storing it in a multidimensional format.
Data visualization − It helps us to represent the data in the form of charts, graphs, plots, maps etc.
Examples − Tableau Desktop, Power BI Desktop, etc.
Data mining − In business, we handle large amounts of data. To search and analyze this data to find valuable insights, we use data mining.
Example − Knime, RapidMiner, etc.
Database − A database stores a large amount of data. There are various types of databases such as relational, NoSQL, and distributed databases.
Examples
- Relational Database − Oracle DB, SQL Server, PostgreSQL.
- NoSQL Databases − MongoDB, Cassandra.
ETL Tool − ETL stands for Extract, transform, and load. It is a process that is used for data integration. It involves extracting data, transforming it, and loading it into a destination.
Examples − Informatica, Ab Initio, IBM DataStage, etc.
- Project management Tools − JIRA software, MS Project, MS Excel.
- Data Modeling Tools − Oracle Data Modeler, Toad Data Modeler
- Reporting and Analytics − MicroStrategy, SAP BusinessObjects Business Intelligence.
Business Intelligence - History
Today, Business Intelligence (BI) plays a very important role in the strategic planning of nearly all major companies and stakeholders.
However, in its early days the concept of BI was quite unclear. It wasn't until years later that the importance of BI was fully recognized, driven by the growing need for data-driven decision-making and competitive advantage. And today we all can see ongoing improvements in BI tools and technologies that have made it a key part of modern business strategy.
Beginning of Business Intelligence (1800's)
The concept of business intelligence was first introduced by Richard Miller Devens in his 1865 book, Cyclopdia of Commercial and Business Anecdotes.
To show that relying on data and factual evidence was more effective than depending on intuition for making business decisions he gave the example of Sir Henry Furnese, who was a successful banker. Later, others also recognized the value of using information and the idea was then further developed by others who saw the benefits of using information.
The Final Decade of the 1800s
The first formalized system of business analytics was introduced by Frederick Taylor in the USA during the final decade of the 1800s. His scientific management approach began with time studies that examined production methods and workers' movements. This analysis aimed to identify inefficiencies and optimize processes leading to increased productivity and improved industrial output.
How Computers Revolutionized Business Intelligence?
Heres a more detailed look at how the technological revolution has transformed Business Intelligence −
Computers and Early DSS (1950-1960)
Let's start with the first digital era in Business Intelligence in which we start shifting from papers to computers. In the 1950s and 1960s, the introduction of computers started transforming how businesses handled data. Initially, these early systems were mainly used for processing transactions. But by the start of the 1960s, businesses began to develop the first Decision Support Systems (DSS), which allowed them to use data analysis to make more informed decisions instead of relying on gut feelings. This period marked the beginning of a shift toward data-driven decision-making in business.
Emergence of Data Management and Business Intelligence (1970-1980)
In the 1970s, Edgar F. Codd introduced the relational database model changing how data was stored and accessed. Then SQL was developed later making data management easier.
In the 1980s, Business Intelligence began to grow with new tools like Decision Support Systems (DSS) and Executive Information Systems (EIS). By 1989, Howard Dresner defined Business Intelligence as a way to improve business decisions through data analysis.
The Evolution of BI Tools (1990-2000): Data Warehousing, OLAP, and Self-Service
As Business Intelligence (BI) technology advanced it transformed how companies handled their data.
In the 1990s, BI software helped companies analyze data better and data warehousing became popular for storing large amounts of information but the technology was complex. By the late 1990s, OLAP tools allowed for detailed data analysis.
In the 2000s, BI tools became more user-friendly and integrated with systems like ERP and CRM. Self-service BI also emerged letting users perform their own analyses. By 2005 "Big Data" became a key concept leading to tools designed for handling larger and more complex data.
Business Intelligence in AI & ML Era (2010 -2020)
As technology evolved, so did Business Intelligence (BI). In the 2010s the BI began leveraging Big Data and cloud tools like Tableau and Power BI making it easier for you to grasp complex data. And then we will be moving into the 2020s, the era of AI and machine learning. AI and Machine Learning were introduced, providing real-time insights and automating decisions. Today BI focuses on real-time analytics and predictive tools helping you make smarter business choices.
Main Uses of Business Intelligence
Suppose you're a business owner, entrepreneur, or part of a management team. In that case, this chapter will provide you with a solid understanding of why your business or department truly needs Business Intelligence.
Uses of Business Intelligence
There are three main uses of Business Intelligence −
- Decision Making
- Business Performance Management
- Finding Business Opportunities and Identifying Problems
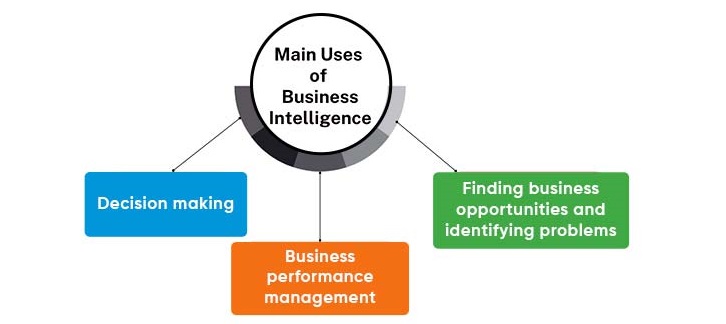
1. Decision Making
In this context, decision-making refers to the support that Business Intelligence offers to decision-makers, such as managers. It helps them make informed business decisions across all levels strategic, tactical, and operational by providing valuable information and insights.
Strategic
Example − On which product we should invest for the long run output?
Tactical
Example − To meet yearly targets which promotion we should repeat?
Operational
Example − How many part-time staff should we hire for the weekend?
2. Business Performance Management
The second main use of business intelligence is business performance management. Every successful company has managers at various levels who closely monitor the performance of their individual sections. Constant monitoring keeps them updated on the state of the business and guarantees that performance is in line with their objectives and the more general expectations set by management, including SLAs and Targets.
BI supports two parts of business performance management −
- To understand whats happening in the business.
- To track whether the performance is in accordance with the set objectives and goals.
3. Finding Business Opportunities and Identifying Problems
The third and the last most important part of using BI to find business opportunities identify problems. The third key use of BI is to proactively discover opportunities and identify problems that might have otherwise gone unnoticed. This involves either analyzing data with a specific question in mind or exploring the data without a particular focus, aiming to uncover hidden insights and potential issues.

Processes Supporting Uses of Business Intelligence
The three main processes that support the main use of BI are −
- BI Reporting
- Business Analytics
- Data mining
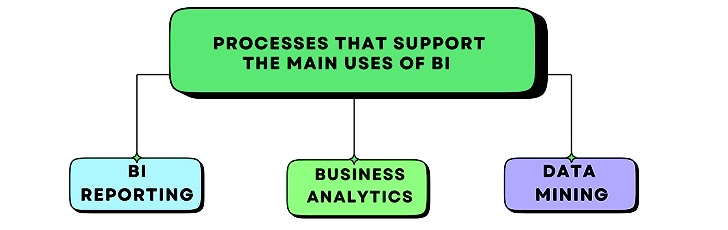
1. BI Reporting
BI reporting involves the creation, development, and delivery of BI reports to decision-makers. These reports offer a clear and concise overview of the business by summarizing data into information that includes KPIs, business metrics, charts, tables, and more. They allow for a multi-dimensional view of the data, making it easier to understand and analyze.
2. Business Analytics
Business Analysis is one of most important processes that supports the main use of BI. Analytics can be confusing because there are so many terms like BI, data analytics, and business analytics that seem similar. While these terms are often used interchangeably, analytics generally refers to business analytics or data analytics.
Within BI, analytics focuses on deriving insights through data analysis, classified into descriptive (breaking down data to see details), predictive (guessing future trends), and prescriptive (suggesting the best actions) types. The COVID-19 dashboard example illustrates both descriptive and predictive analytics. So in the end we can say that it's important to check the credibility of the information when learning about analytics.
3. Data Mining
Data mining is about finding valuable information in large amounts of data that isnt easy to spot right away. Its important because sometimes business users dont think of all the questions to ask, and some details might get missed. The idea is to look for patterns, trends, and connections that arent obvious. Instead of starting with specific questions, data mining explores the data to uncover new insights and figure out how to use them effectively.
Why is Business Intelligence Important?
After the emergence of technologies in the market in the late 90s business intelligence became a must-have and especially for the large size companies and for the small and the medium size companies it is good to have.
- Reduced costs and cloud-based solutions
- Open-source and no-cost software
- Proof of successful implementation
Business Intelligence - Concepts
Business intelligence is a concept that brings together ideas from different fields. Whether to use a certain idea in business intelligence depends on the specific needs and available resources.
Some of the commonly used concepts in business intelligence are −
Data Warehouse
A data warehouse is a type of data repository where data from various sources is brought together, organized, and versioned. This organization makes it easier to use for reporting and analysis.
Data Mart
A data mart can either be a building block within a data warehouse or a smaller section taken from it. For example, while a data warehouse holds all the company's data, a data mart might focus on specific areas like sales or finance. This setup allows different departments to quickly access the information they need making data analysis easier and more efficient.
Data Lake
A data lake is a large storage system designed to hold a wide range of data types often in their raw original form. It allows authorized users to access and analyze this data for different purposes. Unlike traditional databases a data lake can store both structured data like tables and unstructured data that are text or images, making it useful for managing different information. Organizations can collect and use data from multiple sources without having to first process it because of this flexibility.
Data Vault
A data vault is a way to design and manage data warehouses that makes it easy to store and access data from different sources. It helps create a flexible and scalable system so you can handle changes and updates over time.
ODS
The ODS stands for Operational Data Store. The term ODS refers to an Operational Data Store, a system used for operational reporting and managing day-to-day business activities. Like a data warehouse it holds integrated subject-focused data but unlike a data warehouse and ODS only stores current data without keeping historical records. This makes it perfect for real-time reporting offering quick access to the latest information. For instance, a company might use an ODS to track daily sales figures or monitor current inventory levels.
ETL
ETL stands for extract, transform, and load. ETL is the process of extracting data from sources like files, databases, or websites, transforming it based on business and technical rules, and then loading it into a target data store. Though often linked with data warehousing and business intelligence, ETL is also frequently used for data migration and integration. This process ensures data is well-prepared and organized for use in various systems or applications.
Data Integration
Transactional systems store data specific to each application, like separate databases for in-store purchases, online sales, and employee information. To answer complex questions that require data from multiple sources, this data needs to be integrated in a data warehouse. Integration involves combining and aligning the data, resolving inconsistencies and making it compatible for accurate analysis and a unified view of the business.
Machine Learning
Machine learning is a subset of artificial intelligence that enables systems to learn from data, identify patterns, and make predictions on their own. These models, built using existing data, can adjust and improve their predictions as new data is introduced.
Many Business Intelligence (BI) tools now use ML to help users discover insights and analyze data more easily. You dont need to be a data scientist to use these features, as they often come with simple drag-and-drop or point-and-click options. ML in BI helps automate insight generation and makes advanced data analysis more accessible.
Data Mining
Data mining means looking through large amounts of data without having a specific question. The idea is to find interesting patterns, trends, and connections. Analysts then show what they've found to business leaders, who figure out how to use these insights. This is useful because it can bring to light important details that might not come up with straightforward questions.
Sometimes, the process doesnt reveal new insights, but when it does, it can help with things like improving marketing strategies for reducing customer churn. If the results are too costly or dont offer enough return, the idea might be set aside for further analysis. Data mining, along with reporting and analytics, helps businesses gain a better understanding and make informed decisions.
Business Intelligence - Architecture
Business Intelligence (BI) architecture is essentially the proper arrangement of all the components in a BI solution designed to meet the unique needs of a business or organization. When we talk about an architectural diagram in BI it is like a map that visually shows all the parts of a BI solution and how they work together. These diagrams can be simple just giving a general idea or very detailed showing specific tools and components. Sometimes they mix both approaches depending on who needs to understand them.
Since every organization has its own set of BI requirements the BI architecture they deploy will differ. Some businesses might start with a basic setup and gradually build on it as their needs expand.
These components are selected based on specific requirements, budget, and available tools. For instance if an organization doesnt need historical data and its data source can handle analytical queries there might be no need for an additional data repository like a data warehouse.
Theres no one-size-fits-all approach to BI architecture. What works for one organization might not work for another.
When looking at BI architecture examples, it's important to remember that these diagrams are just examples. They aren't necessarily best practices or comprehensive solutions. Instead, they showcase how BI architecture can range from simple to complex depending on the needs of the business.
Architecture Categories
These architectures typically fall into two categories −
- Data-in-place BI Architectures − Where data is analyzed where it resides.
- Data Repository-based BI Architectures − Where data is moved to a central repository for analysis.
Architecture 1
In this architecture, there is only one data source, and the data source supplies the data in the form of static reports to the next step which is the reporting and analytics platform.
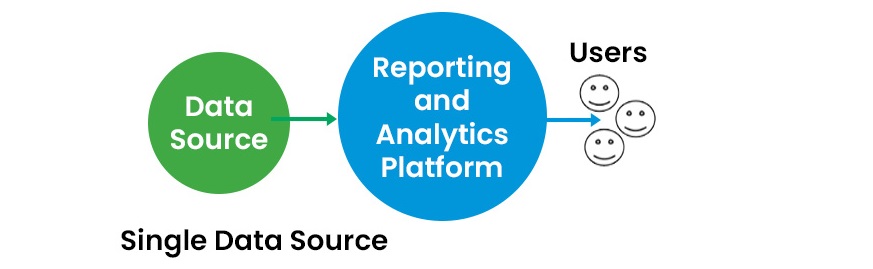
A Reporting and Analytics Platform (RAP) offers a more robust solution. It supports various types of outputs including static reports, accurate pixel-perfect reports, data analysis, and dynamic visualizations.
RAP also provides multiple ways to deliver these reports, such as via email, FTP/SFTP or through a portal. It also includes features like role-based access just to ensure the right people see the right data and offers different tools made for both developers and end-users.
Example
A sales team might receive a monthly PDF report with sales figures while a data analyst could use the RAP to create and explore custom visualizations based on real-time data.
Architecture 2
In the earlier architectures, we focused on using just one data source. In Architecture 2, while there are multiple data sources, the data from these sources isn't merged together. Different users might access these separate data sources using the same frontend tool but if they need to combine data from different sources they have to do it themselves.
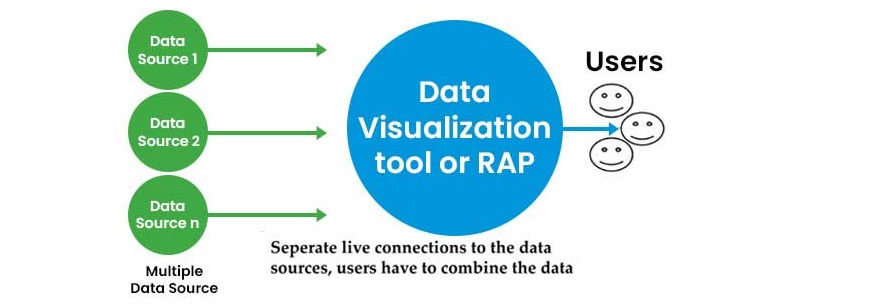
Example
A marketing team might pull customer data from one source and sales data from another using the same dashboard but they'd need to manually combine this information to get a complete view.
Architecture 3
The BI architecture given above consists of multiple components working together to turn raw data into useful information. The core systems that hold operational and transactional data are known as data sources. This data is cleaned and prepared for analysis with the aid of data integration tools, especially ETL. After all the data is prepared the data is kept in operational data stores, data lakes, and data warehouses.
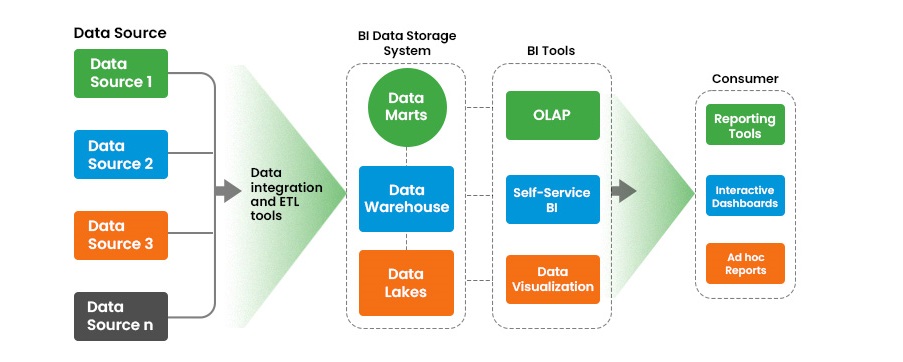
After that BI tools evaluate and present the data to assist users in identifying patterns and reaching choices. Tools for information distribution make it easy to work with this data giving you access to real-time information and in-depth views.
In the given architecture above,
1. Data Sources
In the given architecture the data sources are the systems that hold the operational and transactional data.
Example
Source systems are like the various places where a company stores its important data. Think of them as different shelves in a big library.
The word shelves mentioned here are the ones that hold data from different areas, like sales records, customer details, financial transactions, and even data from external sources like market trends or customer surveys. All this data is important for the company to make informed decisions.
When choosing data sources it's important to consider how relevant, up-to-date, and accurate the data is along with how detailed it is. You might also need a mix of different data types that are structured, semi-structured, and unstructured just to meet the needs of executives and other users.
2. Data Integration Tools
The data integration tools are the ones that are used for the analysis of data. The data integration technology that is used here is ETL.
The business intelligence architecture includes data cleansing and data profiling they both are used to identify data quality issues and to fix them.
Additionally, the BI architecture includes data cleansing and data profiling, which are essential for identifying and resolving data quality issues. For example, data cleansing might involve removing duplicates or correcting errors in the data, while data profiling helps in understanding the structure and content of the data. Together, these processes ensure that the data used in analysis is accurate and reliable, leading to better business decisions.
3. Data Storage Systems
The storage systems are systems where BI data is stored and managed. The main storage is a data warehouse, which holds structured data in different formats like relational or multidimensional databases. This makes it easy to search and analyse the data. For more specific needs, departments or business units might use smaller data marts connected to the main data warehouse.
Now, before data gets into the data warehouse, it often passes through an operational data store (ODS). Think of the ODS as a temporary stopover for data, where it can also be quickly analyzed, especially for recent transactions.
At the end we can say that there's the data lake usually running on platforms like Hadoop. The data lake is where raw data of all types is stored. This raw data can either be analysed directly in the data lake or filtered and then loaded into the data warehouse for deeper analysis.
4. BI Tools
BI tools help businesses make sense of their data in several ways. They let you run custom queries, dig into data through mining, and perform detailed analysis. One of the key features is OLAP (Online Analytical Processing), which lets users quickly explore data from various angles.
With self-service BI tools, analysts and managers can now run their own queries and create reports without needing the BI teams help. These tools also come with data visualization features, like charts and graphs, which make it easy to spot trends and patterns in the data.
5. Consumer
Information delivery tools in BI make it easy for users to view and interact with analytics results. They often include visualizations and self-service options for deeper analysis. For instance, BI dashboards and online portals offer real-time data and customizable views, allowing users to explore details, while traditional reports present data in a fixed format.
In addition to these tools, BI systems often feature data preparation software to organize data for analysis. They also provide tools such as metadata repositories, business glossaries, and data catalogs to assist users in finding relevant data and understanding its context and source.
Types of Business Intelligence (BI)
In this chapter, we will introduce you to various types of business intelligence. After reading this chapter, you'll be able to understand the different types of Business Intelligence.
Based on Various Parameters
- Types of BI- based on analytics
- Types of BI- based on decision
Types of Business Intelligence Based on Analytics
Based on analytics business intelligence is divided into 3 parts −
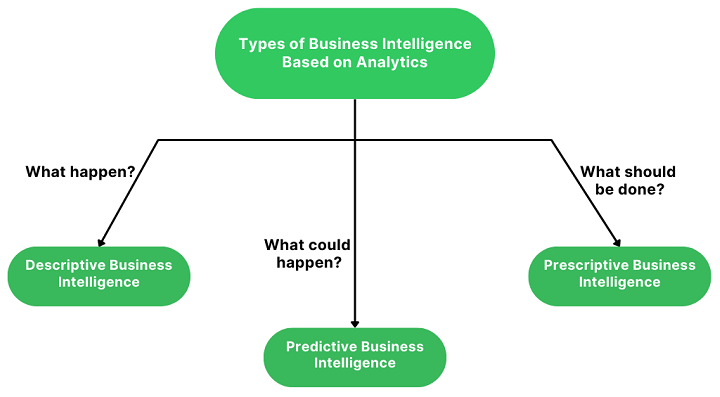
- Descriptive Business Intelligence
- Predictive Business Intelligence
- Prescriptive Business Intelligence
1. Descriptive Business Intelligence
Based on available data it provides insight into what has happened. It gives you information about what happened based on the data. It also helps you understand why it happened.
Example How many people visited the local park last Saturday?
Why did the number of visitors suddenly increase in the afternoon?
2. Predictive Business Intelligence
It predicts what might happen in the future using past data and patterns. It figures out the value of something unknown based on the relationships found in the data.
Example − How many people are expected to attend the community event next weekend?
Which attendees are most likely to switch from attending in-person events to participating in virtual ones?
3. Prescriptive Business Intelligence
The prescriptive business intelligence provides the best option to implement to get the desired output.
Example − What should be the best strategy to increase membership sign-ups for the Java course over the next three months?
How many volunteers are needed to support the Java project?
Types of Bi-based on Decision
- Strategic Decisions
- Tactic Decisions
- Operational Decisions
Strategic Decisions
In the strategic approach, the goal here is to make informed decisions that will shape the companys future, such as deciding which products to focus on or develop to maximize long-term growth and profitability.
Example − On which service we should invest for the long term?
In which location should we launch this course?
Tactic Decisions
The tactical decision involves choosing specific actions to reach a set goal within a defined timeframe.
Example − Which promotion should be required to meet yearly targets?
Operational Decisions
Operational decisions are those decisions that deal with day-to-day decisions that are necessary for the smooth functioning of a business. the practical decisions that need to be made to ensure the business runs efficiently.
Example − How many teachers should we hire for the Java course?
Business Intelligence based on Solution Ownership
Based on the solution based on the ownership the Business intelligence is divided into two parts −
- Self-managed BI
- BIaas
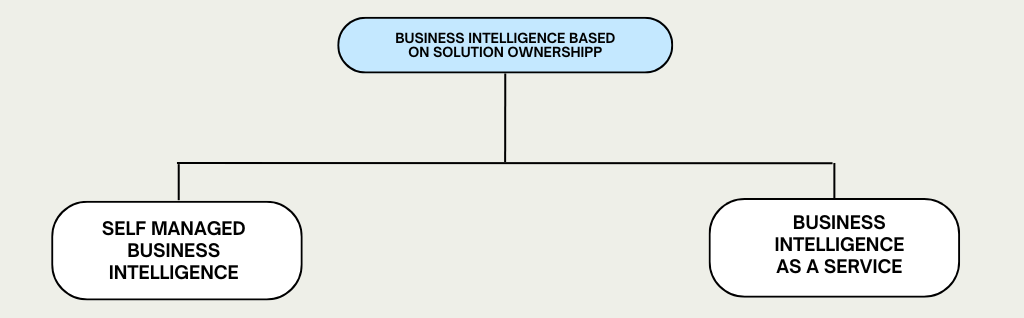
Self-Managed BI
In self-service BI people in a company look at and analyse data on their own, without needing the help of IT or data experts. It gives them user-friendly tools like dashboards and reports so that they can quickly find the answers they need for their business questions without having to rely on others. The self-managed business intelligence is one in which BI offers an environment in which information workers can create and access specific sets of BI reports, queries, and analytics themselves without IT intervention.
BIaaS
The BIaas stands for Business Intelligence as a Service. Businesses are turning to Business Intelligence as a Service (BIaaS), which lets them outsource BI and analytics tasks to experts without needing to hire more staff. In this setup, a vendor provides a fully managed BI solution to multiple clients on a subscription basis, taking care of all the technical work. This way, companies don't need to keep a BI team in-house, as the service provider handles everything.
Difference Between Self-managed BI and Business Intelligence as a Service
| Arabic | Self-managed BI | BI as a Service |
|---|---|---|
| Management | The company will be responsible for managing and maintaining the whole BI system. | The service provider manages and maintains the whole BI system. |
| Time | Deployment and implementation take a longer time. | Shorter implementation and deployment time. |
| Dependency | Low Dependency on third-party providers. | High dependency on third-party providers. |
| Security | In the self-managed BI, the data is more secure as it remains within the company. | The security is managed by the service provider. |
| Access to new technologies | Access to new technologies and features can be slower, as the company is responsible for managing upgrades and migrations. | Companies enjoy faster access to the latest BI technologies and features, with the service provider regularly updating the platform. |
| Scalability | Self-managed BI is not easy to scale due to the need for additional hardware, software, and resources. | BIaaS is easy to scale since it is fully cloud-based. |
| Customization | The Self-managed BI provides more control and customization options because the company manages the system. | BIaas may have limited customization options based on the service providers features and offerings. |
| Cost | Self-managed BI generally has higher upfront costs due to the need for software, hardware, and IT staff. | BIaaS usually has lower initial costs, as it operates on a subscription basis with ongoing costs that cover maintenance and updates from the service provider |
Business Intelligence - Implementations
Implementing Business Intelligence (BI) involves choosing the right solution to meet your specific needs and challenges. We will take a closer look at different types of Business Intelligence (BI) solutions, each designed to address specific needs and challenges in BI implementation.
The types of BI solutions well discuss are based on how they are built and deployed −
- Out-of-the-box BI
- Agile BI
- Self-service BI
Out of the Box BI
Out-of-the-box BI (OOTB BI) solutions come pre-packaged with reports, dashboards, and functionalities for specific applications like CRM, ERP, or HR modules.
- These solutions are ready to use after installation, saving businesses time and effort compared to custom-developed BI.
- Examples include BMC Analytics for BSM and Oracle OOTB BI.
- The main benefits are pre-built reports, higher reliability due to vendor expertise, and automatic updates as the associated applications evolve.
Out-of-the-box BI (OOTB BI) solutions streamline business intelligence by providing ready-to-use reports, dashboards, and functionalities across various domains like Sales, Finance, HR, and ERP systems, including Excel integrations.
Unlike custom BI solutions, which can be time-consuming and complex to develop, OOTB BI solutions are immediately operational after installation.
For instance, tools like BMC Analytics for BSM and Oracles BI solutions come with a wealth of pre-built reports and features, saving significant development time and ensuring reliability through expert design. These reports are regularly updated alongside application upgrades.
Benefits of OOTB BI Include
#1) Quick Insights − Access valuable information instantly through pre-designed dashboards and reports.
#2) Reduced IT Workload − IT handles backend management while users enjoy both corporate and self-service BI on a private cloud.
#3) Adaptable − Standard reports can be customized to fit specific business needs.
#4) User-Friendly and Scalable − Easy to use and capable of growing with your data needs.
#5) Future-Ready − Start with essential modules and expand seamlessly with new data sources.
Overall, OOTB BI provides an efficient, flexible approach to business intelligence, delivering reliable insights and reducing the need for custom development.
Self-service BI
Self-service BI (SSBI) was once promoted as a game-changer by BI vendors. Around 2010, many business managers were led to believe that SSBI would make BI teams unnecessary, allowing them to create reports and analyze data on their own without waiting for help.
However, by 2020, it became clear that BI teams are still very much needed, and their demand is growing. So, what happened to the SSBI promise?
SSBI is a set of tools within BI solutions that lets non-IT users, like marketing or finance managers, analyze data and create reports without needing to code or rely on the BI team. This feature has become common in most BI tools and helps businesses work faster.
However, there are still some misunderstandings about SSBI. Some think it can be run entirely by non-IT teams, makes BI teams unnecessary, doesnt need a server setup, and gives all users full data access. These myths can create confusion about what SSBI can actually do.
In the end, while SSBI offers flexibility, its clear that the role of BI teams is still essential in making sense of complex data.
Agile BI
Agile practices are used by agile business intelligence to create BI products and/or services.
This approach, contrary to the traditional approach which involves making a flowchart initially, has parallel execution of small functionalities that progress towards a final product.
In the past, BI solutions were often developed using the Waterfall methodology, resulting in lengthy and complex projects that frequently faced delays, failed to meet expectations, or were scrapped. These projects typically produced static reports that required code changes and redeployments to address new questions.
Agile BI emerged in the late 2000s as a solution to these issues. By applying agile development principles, Agile BI focuses on creating scalable modules with quicker returns on investment and adapting swiftly to business changes.
It emphasizes features like self-service BI and interactive dashboards, enabling business users to get answers to their questions faster and more flexibly than traditional methods.
In essence, Agile BI offers a more responsive and efficient approach to BI solution implementation, making it a preferred choice for modern businesses.
Applications Areas of Business Intelligence
Business intelligence helps different industries make better decisions by turning data into useful information. The following are the different applications areas of business intelligence −
Business Intelligence in Banking
Business intelligence is essential for banks to gain insights that support smarter decision-making. Heres how BI helps the banking industry −
- Improving Bank Operations − With BI, banks can track key financial metrics, optimize budgeting and monitor the performance of branches and digital channels. This makes it easier to spot inefficiencies and improve overall operations.
- Personalized Customer Targeting − By analyzing customer data like demographics, behavior, and preferencesBI helps banks create tailored campaigns and offers. This boosts customer satisfaction, loyalty, and engagement.
- Managing Risks Effectively − BI helps banks evaluate customer creditworthiness by analyzing historical data, credit scores, and market trends. This reduces financial risks and strengthens the banks ability to make safer lending decisions.
- Fraud Detection in Real-Time − Using machine learning and BI tools, banks can monitor transactions and account behaviors for suspicious activity. This allows them to catch and prevent fraud before it impacts customers.
Business Intelligence in the Manufacturing
Business intelligence is used across many industries, including manufacturing. Since the manufacturing sector has many moving parts, using business data effectively is crucial.
- Improving Production Planning − BI tools enhance production planning by analyzing demand forecasts, production capacity, and resource availability. This helps manufacturers identify and fix production delays, optimize schedules, and reduce lead times.
- Better Inventory Control − BI provides real-time insights into inventory levels and demand patterns. This helps manufacturers manage stock more efficiently, preventing issues like overstocking or running out of items, and reduces associated costs.
- Preventing Machine Failures − By analyzing data from machine sensors, BI tools predict when equipment might fail. This proactive approach allows manufacturers to perform maintenance before a breakdown occurs, keeping production on track.
- Optimizing the Supply Chain − BI analyzes key metrics such as supplier delivery times, transportation costs, and inventory turnover. This helps manufacturers spot inefficiencies, minimize disruptions, and streamline logistics for better efficiency and cost savings.
Business Intelligence in Education
Business intelligence (BI) in education helps schools and colleges use data to make better decisions and improve outcomes. Heres how BI can be used −
- Boosting Student Success − BI tools look at data like grades, attendance, and participation. This helps teachers spot students who might need extra help, track their progress, and adjust their teaching methods to support better learning.
- Making Administration Smoother − BI helps manage school tasks by showing important information like student numbers, budget spending, and staff performance. This makes it easier for schools to handle resources and make smart decisions about staffing and finances.
- Improving Curriculum − By looking at student feedback and performance data BI helps schools update and improve their courses. This ensures that whats taught is relevant and useful for students.
- Increasing Student Engagement − BI tracks how students participate in classes and activities. This information helps teachers find ways to make learning more engaging and interactive.
- Managing Resources Better − BI helps schools see how well resources like textbooks, technology, and facilities are used. This helps in planning and making sure resources are used where theyre needed most.
Business Intelligence in Healthcare
Business intelligence helps healthcare providers use data to improve patient care and facility operations. By analyzing various types of data, BI tools make it easier to make better decisions and enhance the overall efficiency of healthcare services. Heres how BI is used in healthcare −
- Improving Patient Experience − BI tools gather and analyze patient feedback using dashboards and charts. This helps healthcare providers understand what patients like or dont like so they can improve care, personalize treatments, and make the overall experience better.
- Managing Revenue Effectively − BI helps with billing and payments by looking at data from claims, payment patterns, and denied claims. This makes it easier to fix billing issues, reduce the number of denied claims, and increase the amount of money collected.
- Boosting Operational Efficiency − BI tracks important metrics such as patient numbers, waiting times and treatment costs. This helps healthcare facilities spot problems, like long wait times or staffing shortages, and make improvements to provide better service.
- Enhancing Patient Outcomes − BI also looks at data on treatment results and patient progress. By analyzing this information, healthcare providers can adjust treatment plans to better meet patient needs and improve health outcomes.
- Optimizing Resource Use − BI helps monitor the use of resources like medical equipment and staff. This ensures resources are used efficiently, helps avoid shortages, and supports better planning and budgeting.
Real-World Examples of Business Intelligence
Business Intelligence (BI) helps companies solve big problems and improve their operations. By using data smartly, businesses can enhance how they work and better serve their customers. Heres how BI has made a big impact in various companies, transforming their strategies and outcomes −
Challenge
The challenge for LinkedIn was to enhance its job matching algorithms and user engagement on its platform.
Solution
LinkedIn used BI tools to analyze user interactions, professional profiles, job postings and recruiter behavior. By analyzing this data LinkedIn developed better algorithms to recommend jobs and connections based on user profiles and interests.
Results
With the help of BI, LinkedIn improved job recommendations, increasing engagement with users who spent more time on the platform. This also led to better connections between job seekers and employers, increasing the platforms value and boosting revenue from premium subscriptions and recruiter services.
Uber
Challenge
Uber faced an important challenge as it grew: how could they simultaneously improve the lives of drivers and customers? We can see that every day, millions of rides take place, therefore they required a method to maintain order while enhancing the experience for all guests.
Solution
Uber carefully investigated ride data, traffic patterns, driver performance, and customer feedback using business intelligence (BI). They were able to make smart adjustments as a result, including faster ride matching, reducing wait times, and changing surge pricing.
Results
As a result, Uber increased customer satisfaction by reducing wait times and improving the overall ride experience. Increased profits due to more efficient ride assignments were another benefit for drivers. Uber was able to expand internationally while enhancing the experiences of not only customers but drivers also thanks to BI.
Target
Challenge
The biggest challenge faced by Target was in 2013. In the year 2013, Target had to secure a great deal of customer data especially with the possibility of cyberattacks growing. With the personal details of 40 million credit card users at risk, the business needed to improve the methods it used to secure its networks and prevent breaches of sensitive data.
Solution
Target improved its security procedures by implementing Business Intelligence (BI) tools in order to address this issue. Target was able to track any unusual activity, identify possible weak points, and evaluate data pertaining to system vulnerabilities with the aid of BI. The organization strengthened its cybersecurity architecture by using BI to obtain important insights into areas that needed to be handled immediately.
Results
Target was able to lower the likelihood of further data breaches, boost customer trust and dramatically strengthen its security protocols as a consequence. By identifying possible threats and addressing shortcomings BI was crucial in helping Target create a system that was more resilient and safe.
FedEx
Challenge
FedEx needed to enhance its delivery accuracy and efficiency to meet customer expectations and manage its vast logistics network.
Solution
FedEx used BI tools to analyze delivery routes, tracking data and operational performance. BI provided insights into factors affecting delivery times and allowed for adjustments to improve accuracy.
Results
With the help of BI FedEx improved its delivery accuracy, reduced operational costs and enhanced customer satisfaction. The insights gained from BI tools helped optimize logistics and streamline the delivery process.
Coca-Cola
Challenge
Coca-Cola had to successfully manage its global operations in order to maintain supply and quality standards across a wide range of markets. The business needed to handle its inventory, distribution and production more efficiently.
Solution
Coca-Cola implemented BI systems to monitor production processes, track inventory levels and analyze market demand. BI tools provided insights into production efficiency, supply chain performance and regional market trends.
Results
Coca-Cola increased supply chain management, reduced inventory levels, and increased production efficiency with the use of business intelligence. Cost reductions, increased product availability, and enhanced operational performance on a worldwide scale resulted from this.
Phases of Business Intelligence Journey
Starting a Business Intelligence (BI) journey involves several key phases. Instead of deep explanation of every phase of software development or project management, we'll give a simple overview of the BI process. This approach will help us clearly map the challenges of each phase, making it easier for those new to BI or IT solutions to follow along.
Understanding these phases sets the context, and will allow you to grasp the challenges more effectively. Let's take a quick look at each phase of the BI journey.
The journey of BI is ordered into three phases −
- Planning Phase
- Development Phase
- Deployment Phase
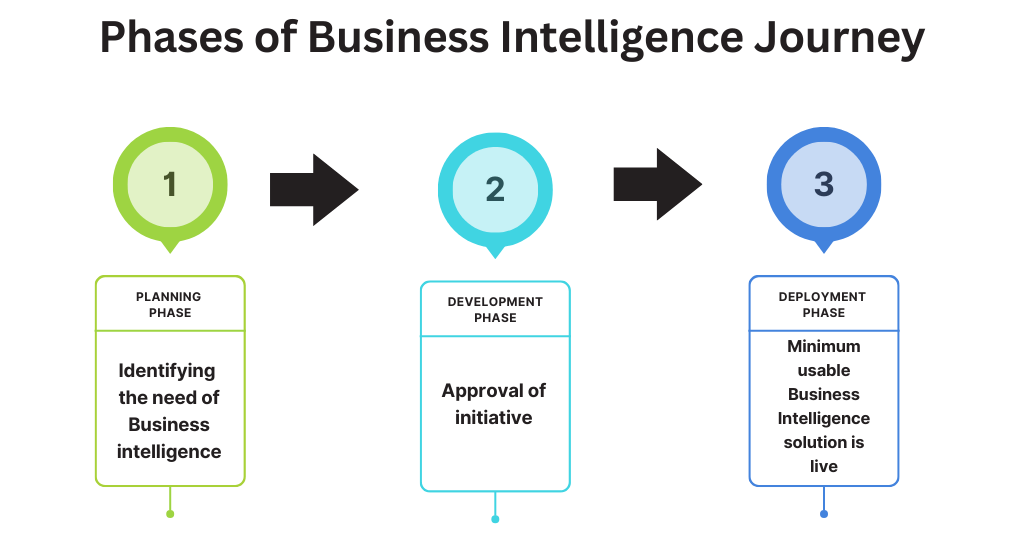
Planning Phase
The BI journey starts with the planning phase. It is the first phase of the BI journey which lays the foundation for the BI journey. This phase does not have any fixed duration of time it can last from weeks to years, depending on the priorities of organization and the resources.
If BI is an urgent need and resources are available, the process can kick off quickly. However, often the initiation phase faces delays due to limited resources. It begins with the birth of the BI vision and ends when management approves the BI initiative.
This is where the organization defines the scope, sets goals, identifies key stakeholders, and assesses available resources. Its also the stage for evaluating existing data sources, choosing the right technology, and creating a roadmap for implementation.
A well-executed planning phase ensures everyone is aligned and ready, setting up the BI journey for success. Both phases are crucial as they shape the direction and pace of the entire BI initiative.
Challenges in Planning Phase
- BI solutions implemented in the past often had implementation timelines that stretched over several years or, in some cases, seemed to never reach completion.
- Some employees or departments worry that the Business Intelligence (BI) initiative might reveal gaps and inefficiencies in their current systems, processes, finances, or ways of working.
Development Phase
The development phase is where the actual work of building your BI solution happens from the moment the project gets started until the system goes live for users.
This phase covers everything: planning, hiring the right team, gathering business requirements, designing the system, setting up hardware and software, building data models, coding, testing, and finally, launching the BI solution.
If youre doing it all in-house, your team handles everything. If youre outsourcing, the external team takes care of most of the technical tasks, while your team manages the project. Sometimes, its a mix of both, with responsibilities shared between your team and the external partner, depending on whats agreed in the contract.
The implementation phase is all about turning your BI plans into reality, step by step, to get your solution up and running.
Deployment Phase
The live phase starts when the BI system is fully deployed and available to users. This phase continues as long as the organization is active because BI is an ongoing process, not just a one-time project.
Once the project is live, it enters a cycle of further development, maintenance, and possible upgrades.
This includes −
#1) Further Enhancement and Development − This involves adding new data sources, creating additional dashboards and reports, and integrating new features.
For example, suppose a company initially launches its BI system using data from sales, customer management, and inventory systems. Later, they decide to include data from a new employee management system to enhance their reporting capabilities.
#2) Maintenance − This includes fixing issues, performing upgrades, and making necessary adjustments to keep the system running smoothly.
#3) Monitoring and Troubleshooting − After the BI system is live monitor its performance and data quality closely for the first few weeks. This helps identify and resolve any issues quickly.
Following this, assess how the BI system is impacting your key performance indicators (KPIs) and adjust your strategy as needed.
Business Intelligence - Team and Roles
Building a strong Business Intelligence (BI) team starts with picking the right people and making sure each person knows exactly what their role is. Before the team can do their job well, it's crucial to have a solid data infrastructure in place. This means having the right tools and systems ready so the team so that the team can get started straight away.
It's also important to understand your organization's current data capabilities and what you need from the BI team. This helps you set clear goals for them. Lastly having a budget is essential to ensure the BI team has the financial resources they need to do their work effectively.
Additionally, keeping communication open and regularly revisiting these needs and goals can help the team stay aligned with the organization's evolving requirements.
Business intelligence roles can be grouped into three categories −
- Technical Roles
- Techno-functional Roles
- Management Roles
Technical Roles
In a BI team, technical roles are focused on creating and maintaining the technical infrastructure. These team members design, develop, and manage BI solutions. They handle everything from coding and testing to supporting and maintaining the systems that drive business intelligence.
Some of the roles are as follows −
1. Business Intelligence Architect
A BI Architect is responsible for designing and maintaining the overall BI architecture. They ensure that BI solutions meet both business and technical requirements, focusing on scalability, performance, and data quality. They also stay up-to-date with the latest tools and technologies and guide the development teams.
2. Business Intelligence Developer
The responsibilities of a BI developer can vary depending on whether they focus on a specific part of the solution, like the frontend or backend, or handle the entire process from start to finish as a full-stack developer. Typically, a BI developer is part of an agile BI team and reports to a BI team lead or the Head of BI. Their main tasks involve designing, developing, and maintaining BI solutions, which include data warehouses, ETL processes, and reporting tools.
In simpler terms, what a BI developer does can change based on whether they're working on just one piece of the puzzle or managing the whole project.
3. Business Intelligence Quality Assurance Engineer
A BI Quality Assurance Engineer ensures that BI solutions are accurate and reliable. They test data flows, verify metrics, and check for performance issues. Their role is crucial in making sure that the BI system delivers the right insights without errors.
Techno Functional Roles
The techno-functional team forms a connection between technical teams and management teams.
Some of the roles are as follows −
1. Business Intelligence Analyst
A BI analyst's main job is to make sense of data and figure out whats important for the business. They look at the numbers understand what the data is telling them and then turn that information into reports and dashboards that help the company make better decisions. Their goal is to find insights that the business can use.
2. BIBA (Business Intelligence Business Analyst)
A Business Intelligence Business Analyst (BIBA) focuses on helping others, like business users and customers, make the most of BI solutions rather than using them themselves. They act as the bridge between business users and the BI development teams, ensuring that everyone is on the same page. Typically, a BIBA is an integral part of the BI team.
Management Roles
Management roles in Business Intelligence (BI) are similar to those in other fields, ranging from Team Leads to high-level positions like VPs and C-Level executives. These roles may vary depending on the size and needs of the organization.
The higher up in the hierarchy, the broader the responsibilities. A Team Lead focuses on guiding their team, a Head of BI oversees an entire department, and so on. Similarly, budget responsibilities also increase with the role, from managing a team budget to overseeing departmental or corporate finances.
Financials of Business Intelligence
Financials of business intelligence refers to the total cost of ownership (TCO) for a Business Intelligence solution, highlighting that these costs go well beyond just the visible tools like dashboards and data visualization platforms.
As noted by Harel Sagiv, the technical reviewer estimating BI costs is particularly complex because they are often deeply integrated with overall IT expenditures and shared resources across different departments.
The total cost of ownership includes both capital and operational expenses, and it accounts for the complete BI ecosystem, including critical components like data integration tools, data warehousing, and security measures.
The purpose is to provide a full understanding of the real costs associated with BI, allowing businesses to set realistic expectations and make educated decisions that are consistent with their financial restrictions and strategic goals. This chapter will look at the expenses of both the technology and the expertise required to develop and maintain an efficient BI solution.
We aim to capture the majority of the costs. Like any other IT solution, a BI solution includes costs related to both people and systems (hardware and software).
People Cost
In the financials of Business Intelligence (BI), people cost refers to all expenses associated with hiring, managing, and retaining the BI team. This includes salaries, benefits, training, and any other costs related to employees directly or indirectly involved in BI activities.
Example
Imagine a company is setting up a BI team with 5 members in Berlin. The annual salary for each member is $70,000. In addition to salaries, there are costs for benefits ($12,000 per person), training ($3,000 per person), and equipment ($2,000 per person). So, the people cost for one year would be −
- Salaries − $350,000 (5 x $70,000)
- Benefits − $60,000 (5 x $12,000)
- Training − $15,000 (5 x $3,000)
- Equipment − $10,000 (5 x $2,000)
- Total People Cost − $435,000 for one year.
This gives a rough estimate of what it costs to maintain the BI team for a year.
System Cost
When determining investments in BI software and hardware, many factors, both functional and non-functional, come into play. These include the number of data sources or applications, current and forecasted data volume, number of expected users, performance requirements, availability needs, local or global usage, response time expectations, the number of environments, data layers, and data retention policies.
Additionally, various options are available, such as on-premises or cloud solutions, proprietary or open-source software, different levels of vendor support, pricing models, licensing options (like named user or enterprise), and the number of tools deployed (e.g., multiple data visualization tools in the same department).
System cost in BI refers to the expenses associated with the technology infrastructure required to support BI activities. These include both hardware and software components necessary for data storage, processing, analysis, and reporting.
The Key components of system cost are as follows −
- Software Licenses − Costs for purchasing or subscribing to BI tools, data analytics platforms, databases, and other necessary software.
- Hardware − Expenses for servers, data storage systems, networking equipment, and other physical infrastructure needed to run BI applications.
- Cloud Services − Costs associated with using cloud-based BI solutions, including data storage, processing, and software as a service (SaaS) fees.
- Data Integration Tools − Costs for tools and platforms used to integrate data from various sources into a unified BI system.
- Maintenance and Support − Ongoing costs for maintaining the BI system, including software updates, hardware repairs, and technical support services.
- Security − Expenses related to ensuring data security, such as firewalls, encryption, and cybersecurity tools.
These factors and components ensure that the BI infrastructure is robust, scalable, and secure, allowing the BI team to analyze data effectively. Properly understanding and managing system costs is crucial in making informed investment decisions for the BI infrastructure.
ROI of Business Intelligence
Return on Investment (ROI) for business intelligence measures the financial benefits gained from BI initiatives compared to the costs involved. In simple terms, ROI helps you understand whether the money spent on BI tools, technology, and teams is delivering value back to the business.
How to calculate ROI for BI?
ROI = ((Total Benefits Total Costs)/ Total Costs) 100
Here,
- Identify Benefits − Determine the financial gains from BI, such as improved decision-making, cost savings, increased revenue, or operational efficiencies.
- Calculate Costs − Add up all the costs involved in implementing and maintaining BI, including software, hardware, people, and training.
- Use the ROI Formula − This formula gives you the percentage of return you get on the money invested in BI.
- For example, if implementing a BI system cost 200,000 and the financial benefits are estimated to be 300,000, the ROI would be −
Example
ROI = ((300,000 200,000) / 200,000) 100 = 50%
This means for every euro spent on BI the company gains 50 cents in return.
Side Benefits of BI
Calculating ROI for Business Intelligence (BI) often focuses on direct benefits like time saved or cost reductions but BI also brings significant benefits. For example, saved time can boost productivity and improved employee motivation can enhance job satisfaction and potentially increase revenue.
BI can also facilitate better upselling and cross-selling, offering a competitive edge. Quantifying these benefits is tricky, but a simple method is to double the direct ROI for a rough estimate.
For instance, a direct ROI of 300% could suggest an overall ROI of 600%. Despite the benefits, some leaders resist BI investments claiming busyness. BI professionals should document and review ROI annually to showcase BIs true value.
Individual Business Intelligence (IBI) - Introduction
What is IBI?
The IBI stands for Individual Business Intelligence. Imagine being able to truly understand yourself through the lens of data, just as businesses do. Individual Business Intelligence (IBI) is about doing exactly that gathering and analyzing your own data to gain insights into your life. By examining patterns, trends, and correlations in this self-collected data, you can make informed decisions that lead to personal growth and improvement.
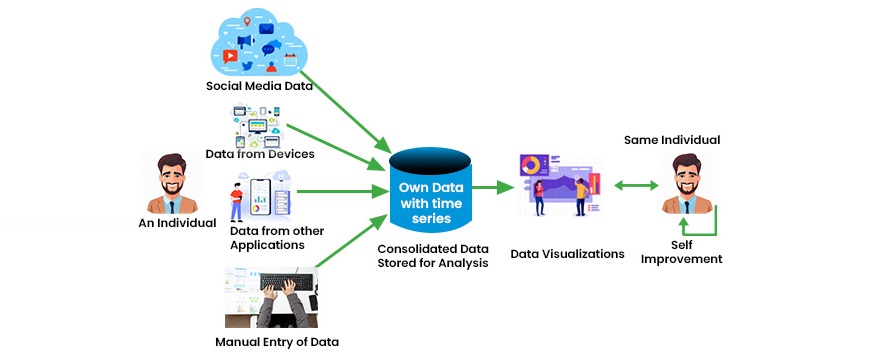
In essence, IBI is the practice of consciously capturing and reflecting on your own data to discover more about yourself and enhance your life. The process involves accumulating data, analyzing it to uncover meaningful insights, and then taking actionable steps to improve based on those findings.
Essentially, IBI is about gathering data about yourself, analyzing it, and using these insights to make meaningful improvements. It's a form of self-reflection driven by data you've consciously captured.
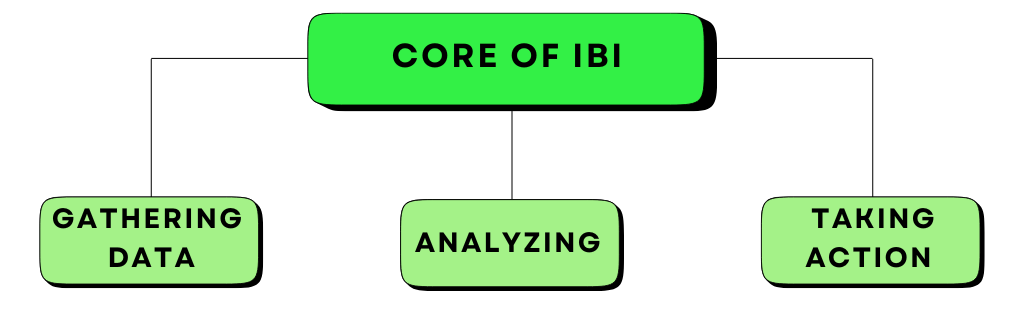
The core of IBI involves three main steps −
- Gathering data
- Analyzing it to uncover trends and patterns
- Taking action to enhance your life based on these findings.
Business Intelligence for Individual
The Individual Business Intelligence (IBI) is about using self-captured data to gain insights into your own life, much like how organizations use Business Intelligence to improve operations. By identifying these connections, you can make informed decisions to improve various aspects of your life.
IBI is a concept and a process any tool, technology, or process can be chosen to implement IBI.
Just as Business Intelligence (BI) is both a concept and a process individual business intelligence (IBI) follows the same approach serving as a specialized subtype within the broader BI framework.
While BI focuses on gathering and analyzing data to enhance organizational performance IBI shifts the focus to the individual. It's about using personal data to gain insights into your own life, identifying patterns, and making informed decisions to improve your well-being.
How Companies Use Your Personal Data to Boost Sales?
Every time you interact online, whether its browsing social media, shopping, or searching for information, popular companies like Facebook, Google, and Amazon are quietly gathering data about you. Theyre piecing together bits of information to create a detailed picture of who you are, what you like, and how you think. Why? Because the better they understand you the more effectively they can offer products or services that youre likely to buy, not just for yourself but also for those around you.
Note − It's a business strategy that focuses on using your personal data to boost sales by aligning their offerings with your needs and interests. While it may feel a bit unsettling it's how these companies aim to stay ahead by delivering exactly what you might want, often before you even realize it.
