- BI - Introduction
- BI - History
- BI - Main Uses
- BI - Concepts
- BI - Architecture
- BI - Types
- BI - Implementations
- BI - Applications
- BI - Examples
- BI - Phases
- BI - Teams and Roles
- BI - Financials
- IBI - Introduction
Business Intelligence - Architecture
Business Intelligence (BI) architecture is essentially the proper arrangement of all the components in a BI solution designed to meet the unique needs of a business or organization. When we talk about an architectural diagram in BI it is like a map that visually shows all the parts of a BI solution and how they work together. These diagrams can be simple just giving a general idea or very detailed showing specific tools and components. Sometimes they mix both approaches depending on who needs to understand them.
Since every organization has its own set of BI requirements the BI architecture they deploy will differ. Some businesses might start with a basic setup and gradually build on it as their needs expand.
These components are selected based on specific requirements, budget, and available tools. For instance if an organization doesnt need historical data and its data source can handle analytical queries there might be no need for an additional data repository like a data warehouse.
Theres no one-size-fits-all approach to BI architecture. What works for one organization might not work for another.
When looking at BI architecture examples, it's important to remember that these diagrams are just examples. They aren't necessarily best practices or comprehensive solutions. Instead, they showcase how BI architecture can range from simple to complex depending on the needs of the business.
Architecture Categories
These architectures typically fall into two categories −
- Data-in-place BI Architectures − Where data is analyzed where it resides.
- Data Repository-based BI Architectures − Where data is moved to a central repository for analysis.
Architecture 1
In this architecture, there is only one data source, and the data source supplies the data in the form of static reports to the next step which is the reporting and analytics platform.
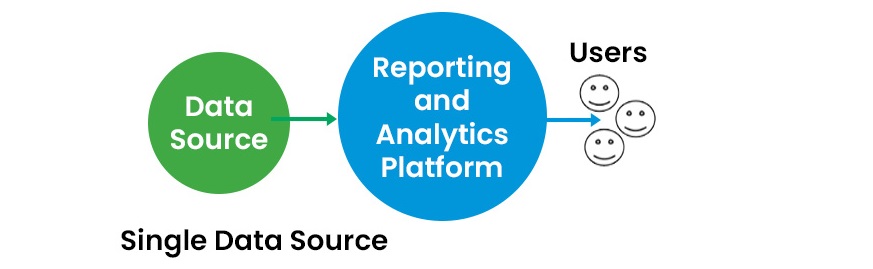
A Reporting and Analytics Platform (RAP) offers a more robust solution. It supports various types of outputs including static reports, accurate pixel-perfect reports, data analysis, and dynamic visualizations.
RAP also provides multiple ways to deliver these reports, such as via email, FTP/SFTP or through a portal. It also includes features like role-based access just to ensure the right people see the right data and offers different tools made for both developers and end-users.
Example
A sales team might receive a monthly PDF report with sales figures while a data analyst could use the RAP to create and explore custom visualizations based on real-time data.
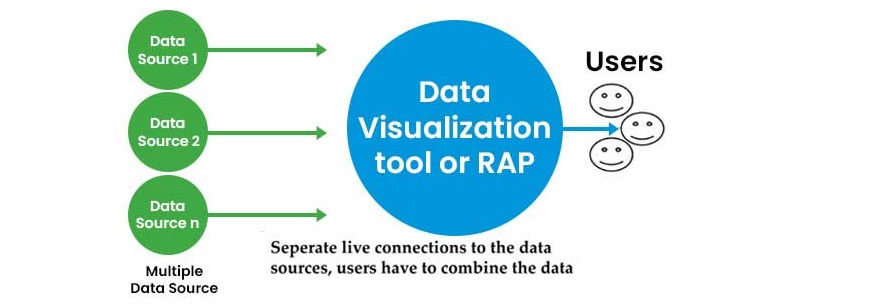
Architecture 2
In the earlier architectures, we focused on using just one data source. In Architecture 2, while there are multiple data sources, the data from these sources isn't merged together. Different users might access these separate data sources using the same frontend tool but if they need to combine data from different sources they have to do it themselves.
Example
A marketing team might pull customer data from one source and sales data from another using the same dashboard but they'd need to manually combine this information to get a complete view.
Architecture 3
The BI architecture given above consists of multiple components working together to turn raw data into useful information. The core systems that hold operational and transactional data are known as data sources. This data is cleaned and prepared for analysis with the aid of data integration tools, especially ETL. After all the data is prepared the data is kept in operational data stores, data lakes, and data warehouses.
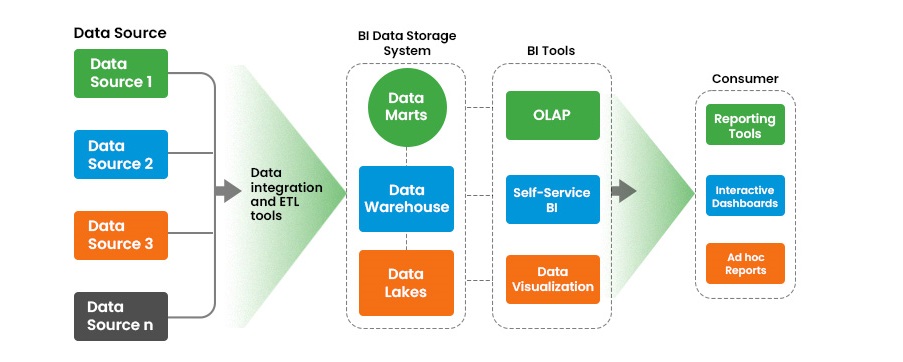
After that BI tools evaluate and present the data to assist users in identifying patterns and reaching choices. Tools for information distribution make it easy to work with this data giving you access to real-time information and in-depth views.
In the given architecture above,
1. Data Sources
In the given architecture the data sources are the systems that hold the operational and transactional data.
Example
Source systems are like the various places where a company stores its important data. Think of them as different shelves in a big library.
The word shelves mentioned here are the ones that hold data from different areas, like sales records, customer details, financial transactions, and even data from external sources like market trends or customer surveys. All this data is important for the company to make informed decisions.
When choosing data sources it's important to consider how relevant, up-to-date, and accurate the data is along with how detailed it is. You might also need a mix of different data types that are structured, semi-structured, and unstructured just to meet the needs of executives and other users.
2. Data Integration Tools
The data integration tools are the ones that are used for the analysis of data. The data integration technology that is used here is ETL.
The business intelligence architecture includes data cleansing and data profiling they both are used to identify data quality issues and to fix them.
Additionally, the BI architecture includes data cleansing and data profiling, which are essential for identifying and resolving data quality issues. For example, data cleansing might involve removing duplicates or correcting errors in the data, while data profiling helps in understanding the structure and content of the data. Together, these processes ensure that the data used in analysis is accurate and reliable, leading to better business decisions.
3. Data Storage Systems
The storage systems are systems where BI data is stored and managed. The main storage is a data warehouse, which holds structured data in different formats like relational or multidimensional databases. This makes it easy to search and analyse the data. For more specific needs, departments or business units might use smaller data marts connected to the main data warehouse.
Now, before data gets into the data warehouse, it often passes through an operational data store (ODS). Think of the ODS as a temporary stopover for data, where it can also be quickly analyzed, especially for recent transactions.
At the end we can say that there's the data lake usually running on platforms like Hadoop. The data lake is where raw data of all types is stored. This raw data can either be analysed directly in the data lake or filtered and then loaded into the data warehouse for deeper analysis.
4. BI Tools
BI tools help businesses make sense of their data in several ways. They let you run custom queries, dig into data through mining, and perform detailed analysis. One of the key features is OLAP (Online Analytical Processing), which lets users quickly explore data from various angles.
With self-service BI tools, analysts and managers can now run their own queries and create reports without needing the BI teams help. These tools also come with data visualization features, like charts and graphs, which make it easy to spot trends and patterns in the data.
5. Consumer
Information delivery tools in BI make it easy for users to view and interact with analytics results. They often include visualizations and self-service options for deeper analysis. For instance, BI dashboards and online portals offer real-time data and customizable views, allowing users to explore details, while traditional reports present data in a fixed format.
In addition to these tools, BI systems often feature data preparation software to organize data for analysis. They also provide tools such as metadata repositories, business glossaries, and data catalogs to assist users in finding relevant data and understanding its context and source.
