
Article Categories
- All Categories
-
 Data Structure
-
 Networking
-
 RDBMS
RDBMS
-
 Operating System
-
 Java
Java
-
 MS Excel
-
 iOS
iOS
-
 HTML
HTML
-
 CSS
CSS
-
 Android
-
 Python
-
 C Programming
-
 C++
C++
-
 C#
C#
-
 MongoDB
-
 MySQL
MySQL
-
 Javascript
-
 PHP
PHP
-
 Economics & Finance
Bollinger Bands Formula & How to Use it?
Bollinger Bands are a technical trading system developed by John Bollinger in the early 1980s to help traders calculate price movements. These trading bands were developed in response to the necessity for adaptive trading bands and the detection that volatility was dynamic, rather than static as was normally assumed at the time.
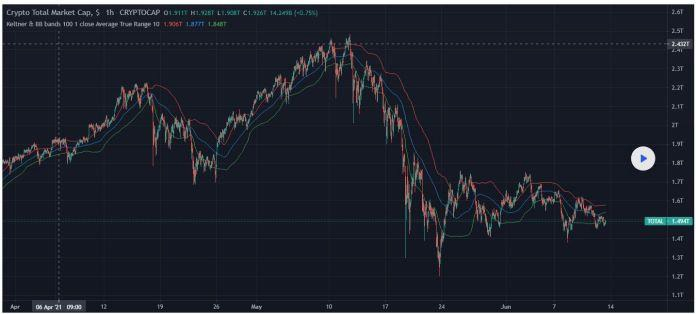
Source − Tradingview. Chart of Ketner Channel & Bollinger Bands
Bollinger Bands are a technical indicator that are used in many financial markets, including stocks, currency, commodities, and futures trading. They may be utilized in a variety of time frames, ranging from very short time periods to hourly, daily, weekly, and monthly intervals.
Bollinger Bands Formula and how to Calculate Them?
In this step, we will look at how to calculate Bollinger Bands using Bollinger bands formula.
BLOU=MA(TP,n)+m*σ[TP,n]
BLOD=MA(TP,n)-m*σ[TP,n]
Where −
BOLU = Upper Bollinger Band
BOLD = Lower Bollinger Band
MA = Moving Average
TP(typical price) = (High + Low + Close) ÷ 3
n = Number of days in smoothing periods (usually 20)
m = Number of standard deviations (typically 2)
σ[TP,n] = Standard Deviation over last n periods of TP
Source − John Bollinger
For Bollinger Bands, the first requirement is to calculate the simple moving average of the assets, that is usually calculated over a 20-day period using SMA. When the price drop occurs, that would become our second data point. One must take the average every 21 days and the next and, in the process, we would be getting the standard deviation for the asset’s price that is useful in economics and finance.
Calculating the standard deviation is as simple as computing the square root of the variance, which is the average of the squared deviations between the mean and the mean variance. After that, divide the standard deviation number by two and use that amount to both add and remove from each point in the SMA's line of sight. These are responsible for the top and lower bands.
What are the limitations of Bollinger Bands?
Bollinger Bands offer indicators for traders to give information about volatility about assets but are not to be implemented independently as trading methodology.
John Bollinger who developed this method has always mentioned that these methods were designed to be used with other indicators and methods.
Because they are derived from a simple moving average, they give the same weight to older price data as they do to the most current, which means that fresh information may be diluted by old information. Furthermore, the usage of a 20-day simple moving average and two standard deviations is rather discretionary and may not be appropriate for all traders in all situations. Traders should make necessary adjustments to their SMA and standard deviation assumptions and keep track of them.

1K+ Views
