
Article Categories
- All Categories
-
 Data Structure
-
 Networking
-
 RDBMS
RDBMS
-
 Operating System
-
 Java
Java
-
 MS Excel
-
 iOS
iOS
-
 HTML
HTML
-
 CSS
CSS
-
 Android
-
 Python
-
 C Programming
-
 C++
C++
-
 C#
C#
-
 MongoDB
-
 MySQL
MySQL
-
 Javascript
-
 PHP
PHP
-
 Economics & Finance
bar() function in C graphics
The bar() function in C graphics is used to draw a filled rectangular bar. It is defined in the graphics.h header file and is commonly used for creating bar charts and filled rectangular shapes in graphics programming.
Syntax
void bar(int left, int top, int right, int bottom);
Parameters
- left − X-coordinate of the top-left corner
- top − Y-coordinate of the top-left corner
- right − X-coordinate of the bottom-right corner
- bottom − Y-coordinate of the bottom-right corner
How It Works
Installation: To use graphics functions, you need to install a graphics library like WinBGIm for modern compilers, or use Turbo C++ with BGI graphics support.
Example
Here's a simple example that demonstrates how to use the bar() function to draw a filled rectangle −
#include <graphics.h>
#include <conio.h>

int main() {
    int gd = DETECT, gm;

    // Initialize graphics mode
    initgraph(&gd, &gm, "C:\TC\BGI");

    // Draw a filled bar from (120,120) to (250,250)
    bar(120, 120, 250, 250);

    // Wait for key press
    getch();

    // Close graphics mode
    closegraph();
    return 0;
}
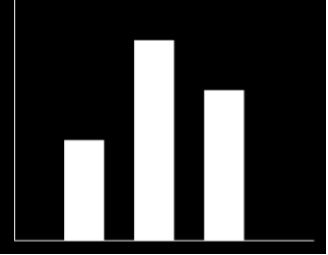
The output shows a filled rectangular bar drawn on the graphics screen −
Key Points
- The
bar()function draws a filled rectangle using the current fill color and pattern - The rectangle is drawn from top-left to bottom-right coordinates
- Use
setfillstyle()to change the fill pattern before callingbar() - Graphics mode must be initialized with
initgraph()before using graphics functions
Conclusion
The bar() function is essential for drawing filled rectangles in C graphics programming. It takes four coordinate parameters and fills the rectangular area with the current fill style and color.

2K+ Views
