
Article Categories
- All Categories
-
 Data Structure
-
 Networking
-
 RDBMS
RDBMS
-
 Operating System
-
 Java
Java
-
 MS Excel
-
 iOS
iOS
-
 HTML
HTML
-
 CSS
CSS
-
 Android
-
 Python
-
 C Programming
-
 C++
C++
-
 C#
C#
-
 MongoDB
-
 MySQL
MySQL
-
 Javascript
-
 PHP
PHP
-
 Economics & Finance
Selected Reading
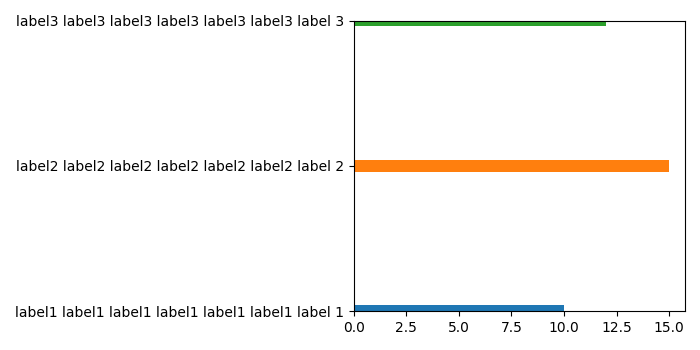
Wrapping long Y labels in Matplotlib tight layout using setp
To wrap long Y label in matplotlib tight layput using setp, we can take the following steps−
- Create a list of a long strings.
- Create a tuple of 3 values.
- Create a figure and add a set of subplots.
- Limit the Y-axis ticks using ylim() method.
- Make a horizontal bar plot, using barh() method.
- Use yticks() method to ticks the yticks.
- Use setp() method to set a property on an artist object.
- Use tight_layout() method to adjust the padding between and around subplots.
- To display the figure, use show() method.
Example
import numpy as np
import matplotlib.pyplot as plt
plt.rcParams["figure.figsize"] = [7.00, 3.50]
plt.rcParams["figure.autolayout"] = True
labels = (
   'label1 label1 label1 label1 label1 label1 label 1',
   'label2 label2 label2 label2 label2 label2 label 2',
   'label3 label3 label3 label3 label3 label3 label 3')
values = (10, 15, 12)
fig, ax = plt.subplots()
plt.ylim((0, 20))
for i in np.arange(3):
plt.barh(10 * i, values[i])
plt.yticks(10 * np.arange(3))
plt.setp(ax.set_yticklabels(labels))
plt.show()
Output

Updated on: 2021-05-06T13:45:34+05:30
1K+ Views

Advertisements