
Article Categories
- All Categories
-
 Data Structure
-
 Networking
-
 RDBMS
RDBMS
-
 Operating System
-
 Java
Java
-
 MS Excel
-
 iOS
iOS
-
 HTML
HTML
-
 CSS
CSS
-
 Android
-
 Python
-
 C Programming
-
 C++
C++
-
 C#
C#
-
 MongoDB
-
 MySQL
MySQL
-
 Javascript
-
 PHP
PHP
-
 Economics & Finance
Selected Reading
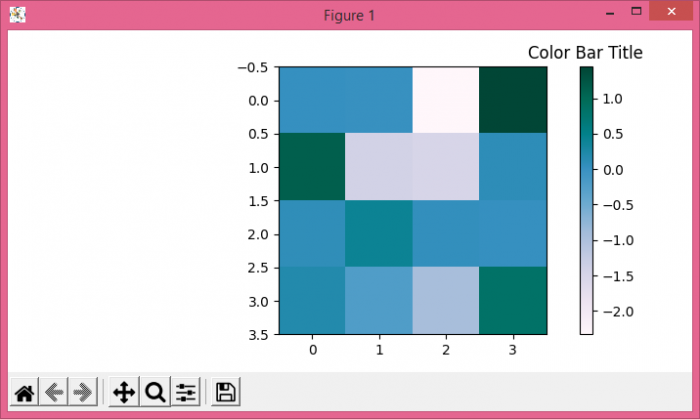
Top label for Matplotlib colorbars
To place a top label for colorbars, we can use colorbar's axis to set the title.
Steps
- Create random data using numpy.
- Use imshow() method to represent data into an image, with colormap "PuBuGn" and interpolation= "nearest".
- Create a colorbar for a scalar mappable instance, im
- Set the title on the ax (of colorbar) using set_title() method.
- To display the figure, use show() method.
Example
import numpy as np
from matplotlib import pyplot as plt
plt.rcParams["figure.figsize"] = [7.00, 3.50]
plt.rcParams["figure.autolayout"] = True
data = np.random.randn(4, 4)
im = plt.imshow(data, interpolation='nearest', cmap="PuBuGn")
clb = plt.colorbar(im)
clb.ax.set_title('Color Bar Title')
plt.show()
Output

Updated on: 2021-05-06T13:36:51+05:30
8K+ Views

Advertisements