
Article Categories
- All Categories
-
 Data Structure
-
 Networking
-
 RDBMS
RDBMS
-
 Operating System
-
 Java
Java
-
 MS Excel
-
 iOS
iOS
-
 HTML
HTML
-
 CSS
CSS
-
 Android
-
 Python
-
 C Programming
-
 C++
C++
-
 C#
C#
-
 MongoDB
-
 MySQL
MySQL
-
 Javascript
-
 PHP
PHP
-
 Economics & Finance
Selected Reading
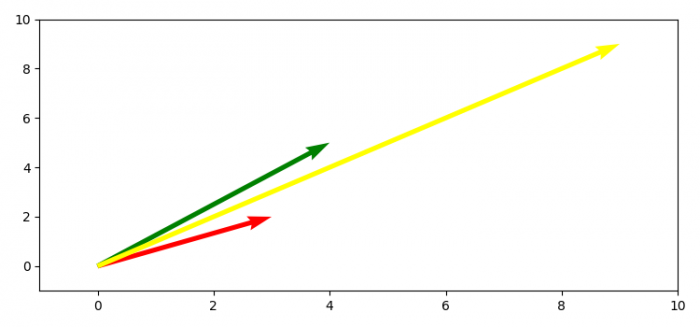
How to plot 2D math vectors with Matplotlib?
To plot 2D math vectors with matplotlib, we can take the following steps−
- Create vector cordinates using numpy array.
- Get x, y, u and v data points.
- Create a new figure or activate an existing figure using figure method.
- Get the current axis using gca() method.
- Set x an y limits of the axes.
- To redraw the current figure, use draw() method.
- To display the figure, use show() method.
Example
import numpy as np
import matplotlib.pyplot as plt
plt.rcParams["figure.figsize"] = [7.50, 3.50]
plt.rcParams["figure.autolayout"] = True
soa = np.array([[0, 0, 3, 2], [0, 0, 4, 5], [0, 0, 9, 9]])
X, Y, U, V = zip(*soa)
plt.figure()
ax = plt.gca()
ax.quiver(X, Y, U, V, angles='xy', scale_units='xy', scale=1, color=['red', 'green', 'yellow'])
ax.set_xlim([-1, 10])
ax.set_ylim([-1, 10])
plt.draw()
plt.show()
Output

Updated on: 2021-05-06T13:46:09+05:30
3K+ Views

Advertisements