
Article Categories
- All Categories
-
 Data Structure
-
 Networking
-
 RDBMS
RDBMS
-
 Operating System
-
 Java
Java
-
 MS Excel
-
 iOS
iOS
-
 HTML
HTML
-
 CSS
CSS
-
 Android
-
 Python
-
 C Programming
-
 C++
C++
-
 C#
C#
-
 MongoDB
-
 MySQL
MySQL
-
 Javascript
-
 PHP
PHP
-
 Economics & Finance
Selected Reading
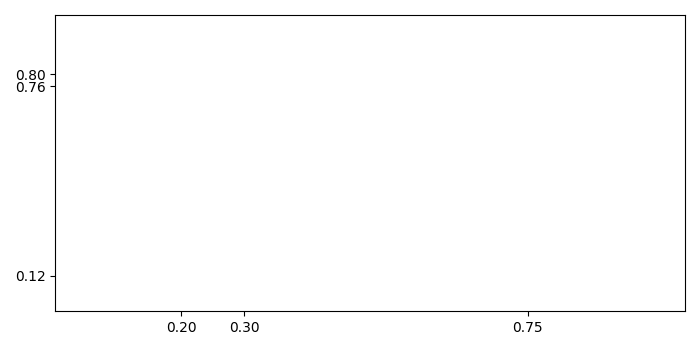
How to set the ticks on a Fixed Position in Matplotlib?
To set the ticks on a fixed position in matplotlib, we can take the following steps −
Create a figure and add a set of subplots.
To set the ticks on a fixed position, create two lists with some values.
Use set_yticks and set_xticks methods to set the ticks on the axes.
To display the figure, use show() method.
Example
import matplotlib.pyplot as plt
plt.rcParams["figure.figsize"] = [7.00, 3.50]
plt.rcParams["figure.autolayout"] = True
fig, ax = plt.subplots()
xtick_loc = [0.20, 0.75, 0.30]
ytick_loc = [0.12, 0.80, 0.76]
ax.set_xticks(xtick_loc)
ax.set_yticks(ytick_loc)
plt.show()
Output

Updated on: 2021-05-08T08:38:47+05:30
5K+ Views

Advertisements