
Article Categories
- All Categories
-
 Data Structure
-
 Networking
-
 RDBMS
RDBMS
-
 Operating System
-
 Java
Java
-
 MS Excel
-
 iOS
iOS
-
 HTML
HTML
-
 CSS
CSS
-
 Android
-
 Python
-
 C Programming
-
 C++
C++
-
 C#
C#
-
 MongoDB
-
 MySQL
MySQL
-
 Javascript
-
 PHP
PHP
-
 Economics & Finance
Selected Reading
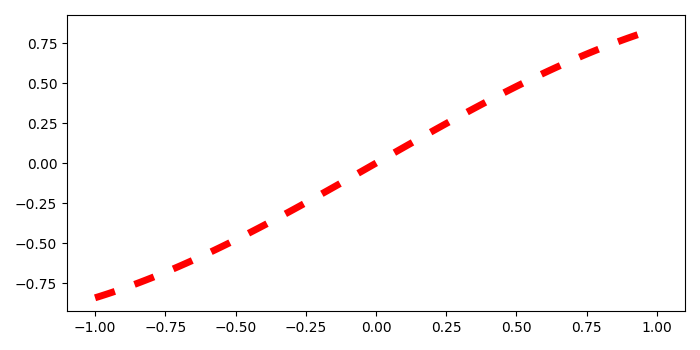
Change the spacing of dashes in a dashed line in Matplotlib?
To change the spacing of dashes in a dashed line in matplotlib, we can take the following steps −
Create data points x and y using numpy.
Initialize two variables space and dash_len with value 3.
Plot x and y using plot() method, with line style '--', dashes tuple stores the property of dashed line.
To display the figure, use show() method.
Example
import numpy as np
from matplotlib import pyplot as plt
plt.rcParams["figure.figsize"] = [7.00, 3.50]
plt.rcParams["figure.autolayout"] = True
x = np.linspace(-1, 1, 100)
y = np.sin(x)
space = 3
dash_len = 3
plt.plot(x, y, c='red', linestyle='--', dashes=(dash_len, space), lw=5)
plt.show()
Output

Updated on: 2021-05-08T08:37:54+05:30
2K+ Views

Advertisements