
Article Categories
- All Categories
-
 Data Structure
-
 Networking
-
 RDBMS
RDBMS
-
 Operating System
-
 Java
Java
-
 MS Excel
-
 iOS
iOS
-
 HTML
HTML
-
 CSS
CSS
-
 Android
-
 Python
-
 C Programming
-
 C++
C++
-
 C#
C#
-
 MongoDB
-
 MySQL
MySQL
-
 Javascript
-
 PHP
PHP
-
 Economics & Finance
How to Move a Specific Chart to a New Sheet in Excel?
Making aesthetically appealing charts and graphs is one of Excel's core capabilities, which makes it a useful tool for organising and evaluating data. You might need to move a particular chart from its current spot to a new sheet while working on a difficult workbook with several sheets. This can be helpful for a number of things, such separating a chart for a more understandable presentation or making a separate page for a particular analysis.
We'll walk you through the steps in this article for relocating a particular Excel chart to a new sheet. This step-by-step instruction will assist you in getting the desired outcome whether you're a novice or seasoned user. We will go over a variety of techniques to complete this work, taking into account Excel 2010, 2013, 2016, 2019, and Microsoft 365.
Move a Specific Chart to a New Sheet
Here, we will use the Chart tool to complete the task. So let us see a simple process to learn how you can move a specific chart to a new sheet in Excel.
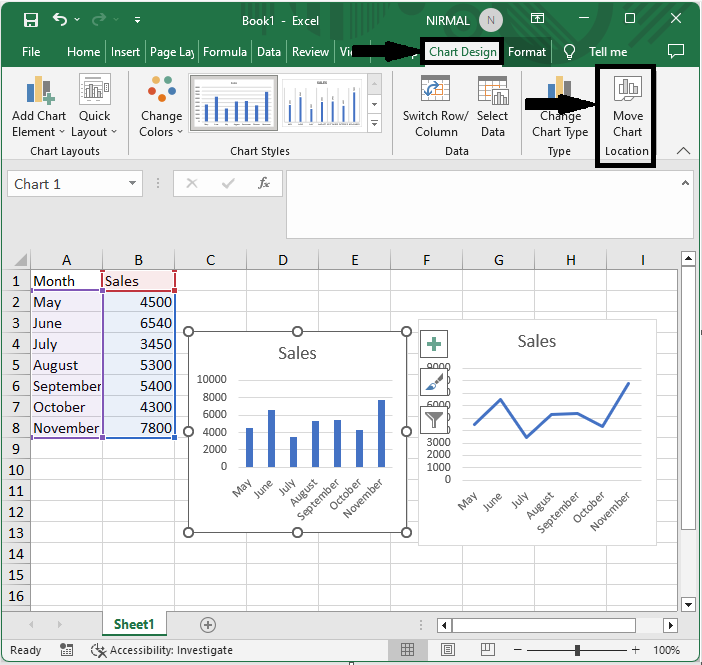
Step 1
Consider an Excel sheet where you have at least one chart.
First, click on the chart, then click on chart design, then click on move chart.
Chart > Chart Design > Move Chart
Step 2
Then click New Sheet and OK to complete the task.
New Sheet > Ok.
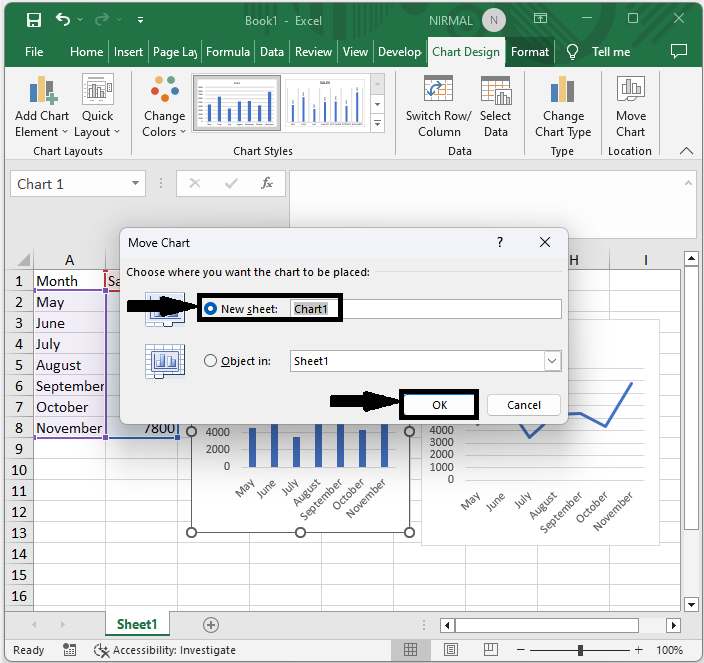
Then you will see that the chart will be moved to the new sheet. This is how you can move a specific chart to a new sheet in Excel.
Conclusion
In this tutorial, we have used a simple example to demonstrate how you can move a specific chart to a new sheet in Excel to highlight a particular set of data.

965 Views
