
Article Categories
- All Categories
-
 Data Structure
-
 Networking
-
 RDBMS
RDBMS
-
 Operating System
-
 Java
Java
-
 MS Excel
-
 iOS
iOS
-
 HTML
HTML
-
 CSS
CSS
-
 Android
-
 Python
-
 C Programming
-
 C++
C++
-
 C#
C#
-
 MongoDB
-
 MySQL
MySQL
-
 Javascript
-
 PHP
PHP
-
 Economics & Finance
How to increase the distance between boxplots using ggplot2 in R?
To increase the distance between boxplots created by using ggplot2, we can reduce the widths of the boxplots and hence the distance between the plots will be automatically increased. This will be required when we have large number of categories for which the boxplots are created.
Check out the below given example to understand how it can be done.
Example
Following snippet creates a sample data frame −
Group<-sample(c("India","China","USA","France","UK"),20,replace=TRUE)
Rate<-rpois(20,5)
df<-data.frame(Group,Rate)
df
The following dataframe is created −
  Group  Rate
1  USA    7
2  UK     2
3  USA    3
4  USA    4
5  France 3
6  China  4
7  USA    5
8  USA    6
9  USA    3
10 UK     6
11 China  4
12 UK     4
13 India  5
14 India  1
15 USA    3
16 France 4
17 France 5
18 France 8
19 China  7
20 India  6
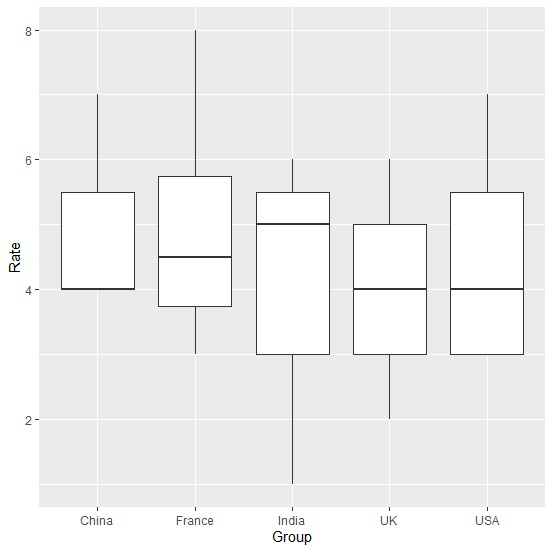
To load ggplot2 package and create boxplots for data in df, add the following code to the above snippet −
library(ggplot2)
ggplot(df,aes(Group,Rate))+geom_boxplot()
Output
If you execute all the above given snippets as a single program, it generates the following output −
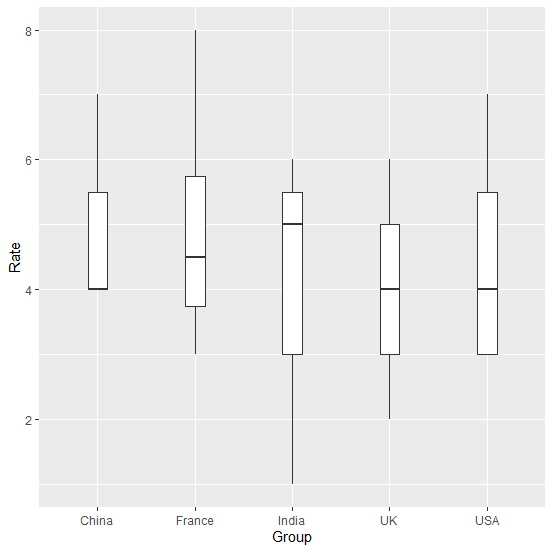
Now, to create boxplots for data in df with larger distance between boxplots, add the following code to the above snippet −
ggplot(df,aes(Group,Rate))+geom_boxplot(width=0.2)
Output
If you execute all the above given snippets as a single program, it generates the following output −

3K+ Views
