
Article Categories
- All Categories
-
 Data Structure
-
 Networking
-
 RDBMS
RDBMS
-
 Operating System
-
 Java
Java
-
 MS Excel
-
 iOS
iOS
-
 HTML
HTML
-
 CSS
CSS
-
 Android
-
 Python
-
 C Programming
-
 C++
C++
-
 C#
C#
-
 MongoDB
-
 MySQL
MySQL
-
 Javascript
-
 PHP
PHP
-
 Economics & Finance
Selected Reading
How to display mean inside boxplot created by using boxplot function in R?
A boxplot shows the median as a measure of center along with other values but we might want to compare the means as well. Therefore, showing mean with a point is likely to be preferred if we want to compare many boxplots. This can be done by using points(mean(“Vector_name”)), if we are plotting the columns of an R data frame then we will reference them instead of vector name.
Example
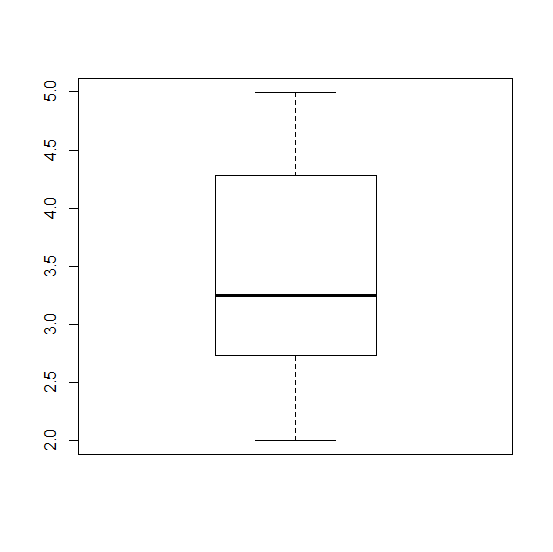
Consider the below data and the boxplot −
x<-runif(100,2,5)
boxplot(x)
Output
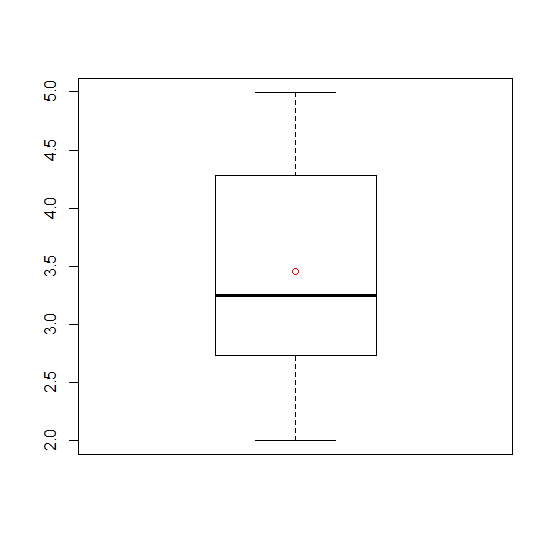
Adding mean point to the boxplot −
Example
points(mean(x),col="red")
Output

Updated on: 2026-03-11T22:50:51+05:30
866 Views

Advertisements