
Article Categories
- All Categories
-
 Data Structure
-
 Networking
-
 RDBMS
RDBMS
-
 Operating System
-
 Java
Java
-
 MS Excel
-
 iOS
iOS
-
 HTML
HTML
-
 CSS
CSS
-
 Android
-
 Python
-
 C Programming
-
 C++
C++
-
 C#
C#
-
 MongoDB
-
 MySQL
MySQL
-
 Javascript
-
 PHP
PHP
-
 Economics & Finance
Selected Reading
How to create a time series plot in R without time vector?
To create a time series plot in R without time vector, we can use ts.plot function.
For Example, if we have a vector called X then we can create the time series plot of X by using the command ts.plot(X), the Output of this command will have a time axis in place of X-axis. Check out the below Examples to understand how it works.
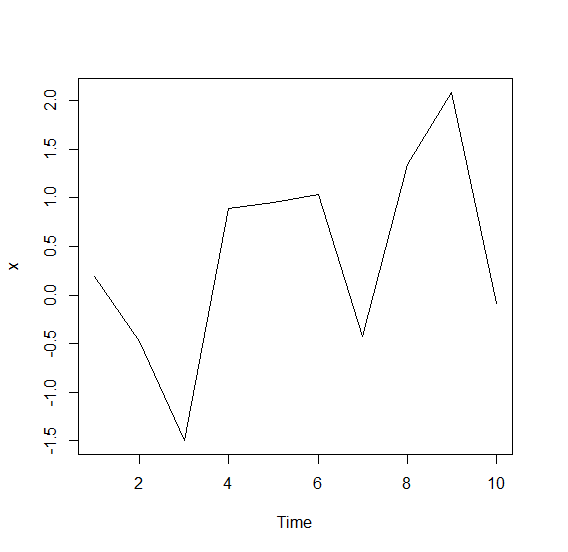
Example 1
Consider the following vector −
x<-rnorm(10)
ts.plot(x)
Output
If you execute the above given snippet, it generates the following Output −
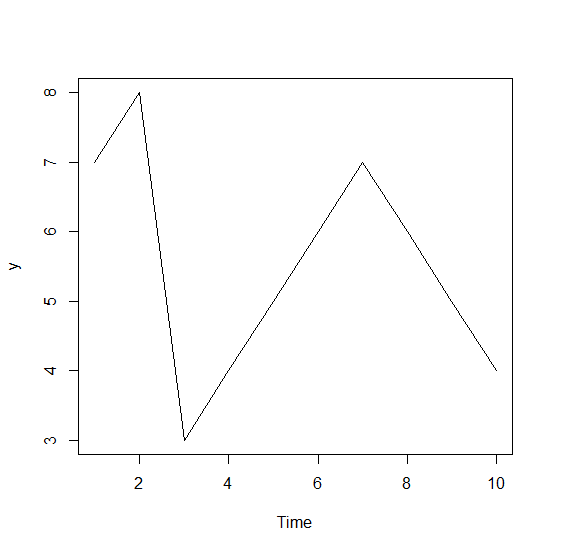
Example 2
To create a time series plot in R without time vector, add the following code to the above snippet −
y<-rpois(10,5)
ts.plot(y)
Output
If you execute all the above given snippets as a single program, it generates the following Output −

Updated on: 2021-10-28T10:03:49+05:30
503 Views

Advertisements