
Article Categories
- All Categories
-
 Data Structure
-
 Networking
-
 RDBMS
RDBMS
-
 Operating System
-
 Java
Java
-
 MS Excel
-
 iOS
iOS
-
 HTML
HTML
-
 CSS
CSS
-
 Android
-
 Python
-
 C Programming
-
 C++
C++
-
 C#
C#
-
 MongoDB
-
 MySQL
MySQL
-
 Javascript
-
 PHP
PHP
-
 Economics & Finance
Selected Reading
How to create a plot of empirical distribution in R?
The empirical distribution can be found by using the function ecdf and if we want to create a plot of empirical distribution then plot function will be used.
For example, if we have a vector called X then plot of empirical distribution can be created by using the below command −
plot(ecdf(X))
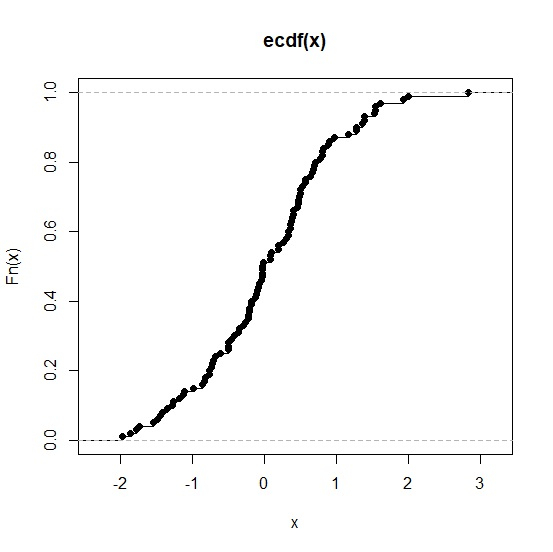
Example 1
To create a plot of empirical distribution in R, use the code given below −
x<-rnorm(100)
plot(ecdf(x))
Output
If you execute the above given code, it generates the following output −
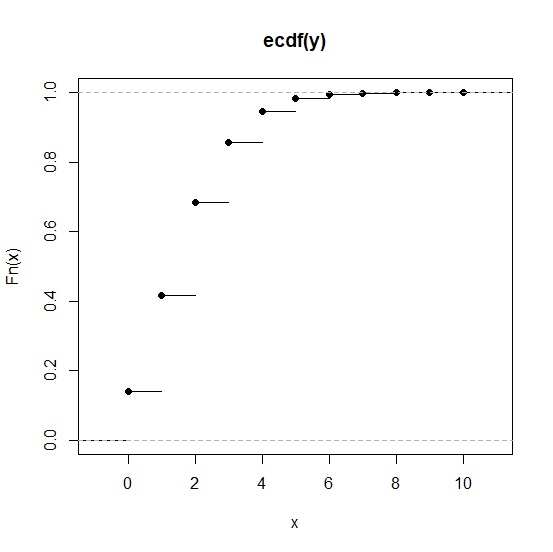
Example 2
To create a plot of empirical distribution in R, use the code given below −
y<-rpois(10000,2)
plot(ecdf(y))
Output
If you execute the above given code, it generates the following output −

Updated on: 2021-11-09T07:04:55+05:30
3K+ Views

Advertisements