
Article Categories
- All Categories
-
 Data Structure
-
 Networking
-
 RDBMS
RDBMS
-
 Operating System
-
 Java
Java
-
 MS Excel
-
 iOS
iOS
-
 HTML
HTML
-
 CSS
CSS
-
 Android
-
 Python
-
 C Programming
-
 C++
C++
-
 C#
C#
-
 MongoDB
-
 MySQL
MySQL
-
 Javascript
-
 PHP
PHP
-
 Economics & Finance
Selected Reading
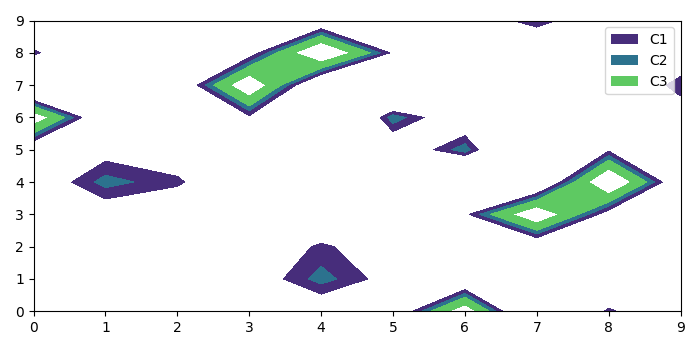
How do you create a legend for a contour plot in Matplotlib?
To create a legend for a contour plot in matplotlib, we can take the following steps−
- Create x, y and z data points to plot the contour function.
- To create a 3D filled contour plot, we can use contourf() method with x, y, z and different levels.
- Make a list of rectangle with the returned contour signature collection and set face color
- Now, place the legend in the plot using proxy (of step 3) and different labels.
- To display the figure, use show() method.
Example
import numpy as np
from matplotlib import pyplot as plt
plt.rcParams["figure.figsize"] = [7.00, 3.50]
plt.rcParams["figure.autolayout"] = True
x, y = np.meshgrid(np.arange(10), np.arange(10))
z = np.tan(x ** 2 + y ** 2)
cs = plt.contourf(x, y, z, levels=[2, 3, 4, 6])
proxy = [plt.Rectangle((1, 1), 2, 2, fc=pc.get_facecolor()[0]) for pc in
cs.collections]
plt.legend(proxy, ["C1", "C2", "C3"])
plt.show()
Output

Updated on: 2021-05-06T13:12:49+05:30
3K+ Views

Advertisements