
Article Categories
- All Categories
-
 Data Structure
-
 Networking
-
 RDBMS
RDBMS
-
 Operating System
-
 Java
Java
-
 MS Excel
-
 iOS
iOS
-
 HTML
HTML
-
 CSS
CSS
-
 Android
-
 Python
-
 C Programming
-
 C++
C++
-
 C#
C#
-
 MongoDB
-
 MySQL
MySQL
-
 Javascript
-
 PHP
PHP
-
 Economics & Finance
Selected Reading
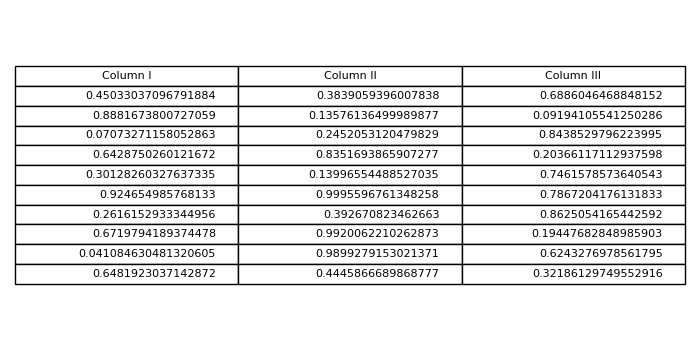
How do I plot only a table in Matplotlib?
To plot only a table, we can take the following steps−
- Create fig and axs, using subplots. Create a figure and a set of subplots.
- Create random data for 10 rows and 3 columns.
- Create a tuple for columns name.
- axis('tight') − Set the limits, just large enough to show all the data, then disable further autoscaling.
- axis('off') − Turn off axis lines and labels. Same as ''False''.
- To add a table on the axis, use table() instance, with column text, column labels, columns, and location=center.
- To display the figure, use show() method.
Example
import numpy as np
from matplotlib import pyplot as plt
plt.rcParams["figure.figsize"] = [7.00, 3.50]
plt.rcParams["figure.autolayout"] = True
fig, axs = plt.subplots(1, 1)
data = np.random.random((10, 3))
columns = ("Column I", "Column II", "Column III")
axs.axis('tight')
axs.axis('off')
the_table = axs.table(cellText=data, colLabels=columns, loc='center')
plt.show()
Output

Updated on: 2021-05-06T13:10:24+05:30
7K+ Views

Advertisements