
Article Categories
- All Categories
-
 Data Structure
-
 Networking
-
 RDBMS
RDBMS
-
 Operating System
-
 Java
Java
-
 MS Excel
-
 iOS
iOS
-
 HTML
HTML
-
 CSS
CSS
-
 Android
-
 Python
-
 C Programming
-
 C++
C++
-
 C#
C#
-
 MongoDB
-
 MySQL
MySQL
-
 Javascript
-
 PHP
PHP
-
 Economics & Finance
Selected Reading
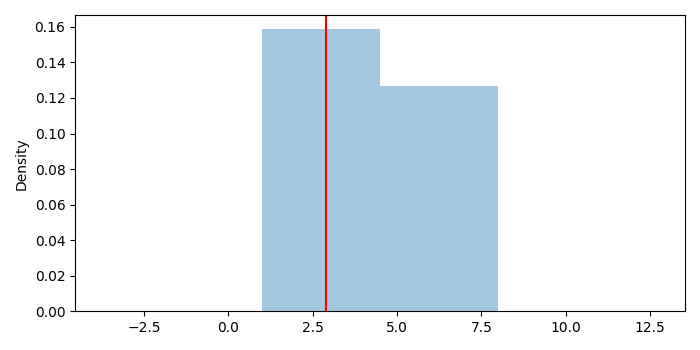
How to add vertical lines to a distribution plot (sns.distplot) in Matplotlib?
To add vertical lines to a distribution plot, we can take the following steps−
- Create a list of numbers.
- Create an axis using sns.displot().
- Get x and y data of the axis ax.
- Plot a vertical line on the plot.
- Remove the line at the 0th index.
- To display the figure, use show() method.
Example
import seaborn as sns, numpy as np
import matplotlib.pyplot as plt
plt.rcParams["figure.figsize"] = [7.00, 3.50]
plt.rcParams["figure.autolayout"] = True
x = [5, 6, 7, 2, 3, 4, 1, 8, 2]
ax = sns.distplot(x, kde=True)
x = ax.lines[0].get_xdata()
y = ax.lines[0].get_ydata()
plt.axvline(x[np.argmax(y)], color='red')
ax.lines[0].remove()
plt.show()
Output

Updated on: 2021-05-06T13:05:00+05:30
3K+ Views

Advertisements