
Article Categories
- All Categories
-
 Data Structure
-
 Networking
-
 RDBMS
RDBMS
-
 Operating System
-
 Java
Java
-
 MS Excel
-
 iOS
iOS
-
 HTML
HTML
-
 CSS
CSS
-
 Android
-
 Python
-
 C Programming
-
 C++
C++
-
 C#
C#
-
 MongoDB
-
 MySQL
MySQL
-
 Javascript
-
 PHP
PHP
-
 Economics & Finance
How can Tensorflow be used to plot the results using Python?
TensorFlow can be used to plot results using the matplotlib library and imshow method. This is particularly useful for visualizing predictions from image classification models and displaying multiple images in a grid format.
Read More: What is TensorFlow and how Keras work with TensorFlow to create Neural Networks?
Transfer Learning and Visualization
Transfer learning allows us to use pre-trained models from TensorFlow Hub for image classification without training from scratch. The intuition behind transfer learning is that if a model is trained on a large and general dataset, it can serve as a generic model for the visual world, having learned useful feature maps.
TensorFlow Hub is a repository containing pre-trained TensorFlow models. TensorFlow can be used to fine-tune learning models for custom image classes.
Plotting Model Predictions
Here's how to visualize predictions from an image classification model using matplotlib ?
import matplotlib.pyplot as plt
import tensorflow as tf
# Assuming we have image_batch and predicted_label_batch from a trained model
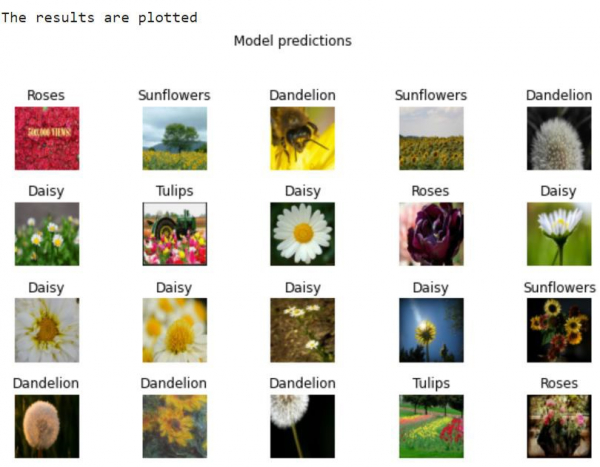
print("The results are plotted")
plt.figure(figsize=(10, 9))
plt.subplots_adjust(hspace=0.5)
for n in range(30):
plt.subplot(6, 5, n+1)
plt.imshow(image_batch[n])
plt.title(predicted_label_batch[n].title())
plt.axis('off')
_ = plt.suptitle("Model predictions")
plt.show()
Code credit − https://www.tensorflow.org/tutorials/images/transfer_learning_with_hub
Output
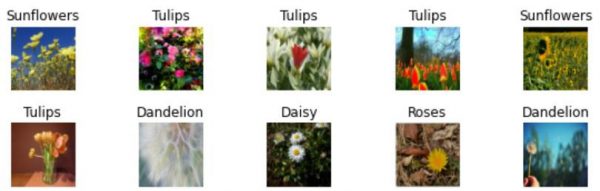
The code generates a grid display showing 30 images with their predicted labels:
How It Works
-
plt.figure(figsize=(10,9))creates a figure with specified dimensions -
plt.subplots_adjust(hspace=0.5)adds vertical spacing between subplots -
plt.subplot(6,5,n+1)creates a 6×5 grid of subplots -
plt.imshow()displays each image from the batch -
plt.title()shows the predicted label above each image -
plt.axis('off')removes axis labels for cleaner visualization
Conclusion
TensorFlow with matplotlib provides powerful visualization capabilities for displaying model predictions. This approach is essential for evaluating image classification models and understanding their performance visually.

520 Views
