
Article Categories
- All Categories
-
 Data Structure
-
 Networking
-
 RDBMS
RDBMS
-
 Operating System
-
 Java
Java
-
 MS Excel
-
 iOS
iOS
-
 HTML
HTML
-
 CSS
CSS
-
 Android
-
 Python
-
 C Programming
-
 C++
C++
-
 C#
C#
-
 MongoDB
-
 MySQL
MySQL
-
 Javascript
-
 PHP
PHP
-
 Economics & Finance
Application Of Linear Graphs
Introduction
The applications of linear graphs are widely seen in day-to-day life. Graphs in the form of a straight line Ax+By+C=0 are called Linear graphs. In the standard form of line equation, A and B are coefficients, x and y are variables and C are a constant.
In simple terms, a linear graph is a representation of the relationship between two or more variables. By plotting the variables of the equation or say the points x,y,z, etc., on a graph we get a straight line. The applications of linear graphs are widely seen in analysing and predicting future events in all the fields of sciences.
In this tutorial, we will learn about linear graphs and their applications along with a few solved problems.
Linear graphs
A diagram or say a graph that represents an association between two or more variables is called a Linear graph. The variables can also be considered as quantities.
They are used for showing the change in a series of data points over a period of time.
For example,
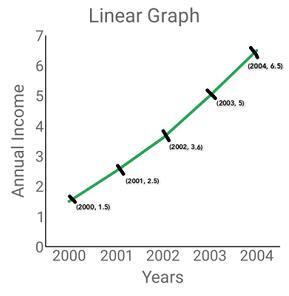
The annual income of a person X from the year 2000 - 2005 is given below.
| Years | 2000 | 2001 | 2002 | 2003 | 2004 |
|---|---|---|---|---|---|
| Annual Income(in lakhs) | 1.5 | 2.5 | 3.6 | 5 | 6.5 |
Applications of linear graphs
The linear graphs are used to find the displacement, velocity, speed, distance etc., for the objects in motion with respect to time.
The linear graphs also represent money and expenditure or income over a period of time.
In pharmaceutical studies, the exact power of medicines is found by applying a linear graph.
Estimation of a person?s weight according to their height can be charted with the help of linear graphs.
The conversion of Celsius to Fahrenheit of a set of observed degrees of a person or place for a particular study can be read through a linear graph.
This graph can also display the counting of the human population in a particular country over a period of time.
The consumption of natural resources over a period of time can be studied through linear graphs.
Solved examples
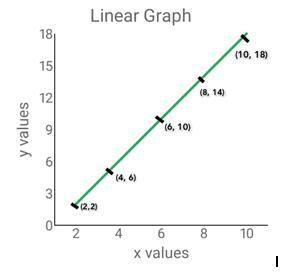
1)For the given equation 2x-y=2 the set of x values is provided x= 2,4,6,8 and 10, find the corresponding y values and represent the values in a linear graph.
Answer:
When the x values are substituted in the given equation 2x-y=2, we obtain
$$\mathrm{2(2)-y=2}$$
$$\mathrm{4-y-2=0}$$
$$\mathrm{\Rightarrow y= 2}$$
$$\mathrm{2(4)-y=2}$$
$$\mathrm{8-y-2=0}$$
$$\mathrm{\Rightarrow y= 6}$$
$$\mathrm{2(6)-y=2}$$
$$\mathrm{12-y-2=0}$$
$$\mathrm{\Rightarrow y= 10}$$
$$\mathrm{2(8)-y=2}$$
$$\mathrm{16-y-2=0}$$
$$\mathrm{\Rightarrow y= 14}$$
$$\mathrm{2(10)-y=2}$$
$$\mathrm{20-y-2=0}$$
$$\mathrm{\Rightarrow y= 18}$$
Tabulating the x and y values, we get
| x | 2 | 4 | 6 | 8 | 10 |
|---|---|---|---|---|---|
| y | 2 | 6 | 10 | 14 | 18 |
By plotting the above points, we get a linear graph
2)Plot the given points on a graph,
| x | 1 | 2 | 3 | 4 | 5 |
|---|---|---|---|---|---|
| y | 0 | 4 | 7 | 10 | 13 |
Answer:
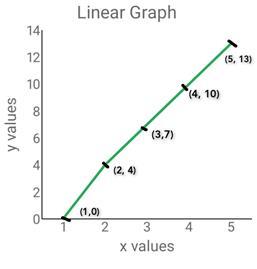
Therefore, the above-drawn graph locates the given x and y values.
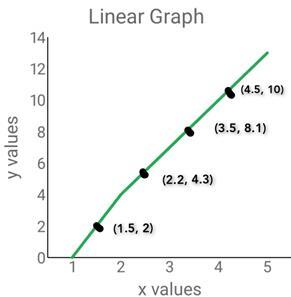
3)From the linear graph given below, tabulate the x and y values.
Answer:
When the x and y values in the graph given above are tabulated, we get
| x | 1.5 | 2.2 | 3.5 | 4.5 |
|---|---|---|---|---|
| y | 2 | 4.3 | 8.1 | 10 |
4)Fred travelled 11.9 km for 4.8 hours to reach his destination. Let us read his travelogue for further details.
When Fred started his car ride, he took his first break after driving for 2.5 hours. By that time, he had travelled 4.4 km. Then he covered 6.2 km in 3 hours, 8 km in 3.5 hours, 8.5 km in 3.8 hours and finally reached his destination at 11.9 km. Represent the given data as a graph. Is the obtained graph linear?
Answer:
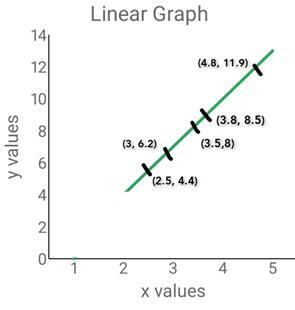
Therefore, we graphically represented the given data. Yes, the obtained graph is linear.
5)The increase of production rate of the X company is given below.
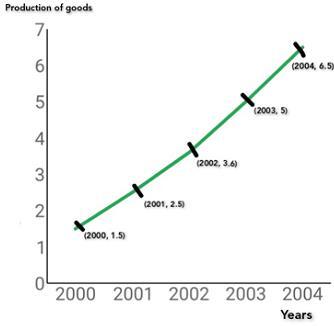
From the given linear graph, find the following:
In which year the production of goods rate increased to 3.6?
(b) In the year 2003 what is the production of goods rate of the X company?
Answer:
From the given linear graph, in the year 2002 the production of goods rate increased to 3.6.
In the year 2003 the production of goods rate of the X company is 5.
Conclusion
The general equation of a straight line is Ax+By+C=0.
An equation with degree one is called a linear equation.
If the plotted points on a graph form a straight line, then it is said to be linear.
If the equation with degree one is represented as a graph or a straight line, then it is said to be linear.
The relationship between two or more variables is represented by a linear graph.
FAQs
1. What if the linear equation is written in the form y = mx +b?
If a linear equation is in the form of y = mx + b then called the slope or the y-intercept of the line. This form is also called slope-intercept form or slope-intercept equation. And additionally, it is known as the general equation of a straight line.
2. What is an ordered pair in linear equations?
The ordered pair is expressed in the form (x,y). It contains the plotted or say obtained x and y coordinates. It is called the solution to the given system of linear equations.
3. How do we find whether the given system of linear equations is consistent or not?
In a graph, if we find that the plotted values of the given system of linear equations form any intersection or coincidence then the given pair of linear equations is consistent.
4. What is the difference between a unique solution and an infinite solution of a consistent pair of linear equations?
In a graph, if we find that the values of the equations have a point of intersection then the solution is Unique.
Similarly in a graph, if the values of the equation form just a point of the coincidence then it is sure that the given pair of consistent linear equations has infinitely many solutions.
5. What is a graphical representation method of solving linear equations?
The Graphical representation of the values of given system linear equations solved by the elimination method can also be said as the Graphical Method of solving linear equations.
If we plot the graph of the first equation and then the following equation, the lines will intersect at a point (x,y) in one of the four quadrants. That respective point will be the exact solution obtained by the substitution or cross-multiplication method.
6. What is the difference between linear and line graphs?
The set of points that are joined to form a linear graph is collinear.
The set of points that are joined to form a line graph may not be collinear.

703 Views
