- Apache Bench - Home
- Apache Bench - Overview
- Apache Bench - Environment Setup
- Testing Our Sample Application
- Testing Multiple URLs Concurrently
- Preparation for Testing Dynamic Pages
- Sequential Test Cases for Dynamic Pages
- Comparison of Outputs
Apache Bench - Quick Guide
Apache Bench - Overview
Performance testing has proved itself to be crucial for the success of a business. Not only does a poor performing site face financial losses, it can also lead to legal repercussions at times.
No one wants to put up with a slow performing, unreliable site in important online interactions such as purchasing, online test taking, bill payment, etc. With the Internet being so widely available, the range of alternatives is immense. It is easier to lose clientele than gain them and performance is a key game changer.
Need for a Load Testing Tool
If we can understand what is the need for a load testing tool, it will give us the reason and motivation to use it. Some famous business sites have suffered serious downtimes when they get large number of visitors. E-commerce websites invest heavily in advertising campaigns, but not in Load Testing. Therefore, they fail to ensure optimal system performance, when that marketing brings in traffic.
Another familiar example of ignoring load testing is that of error establishing connection in WordPress websites. Therefore, it is a good idea to load test a website or application before its deployment in production. It is nice to quickly establish a best-case scenario for a project before running more detailed tests down the road.
What is Apache Bench?
Apache Bench (ab) is a tool from the Apache organization for benchmarking a Hypertext Transfer Protocol (HTTP) web server. Although it is designed to measure the performance of Apache web server, yet it can also be used to test any other web server that is equally good. With this tool, you can quickly know how many requests per second your web server is capable of serving.
Features of Apache Bench
Let us see the important features and limitations of Apache Bench. The features and limitations are listed below −
Being an open source software, it is freely available.
It is a simple command line computer program.
It is a platform-independent tool. It means that it can be invoked on Linux/Unix or on Windows server equally well.
It can conduct load and performance test for only web server - HTTP or HTTPS.
It is not extensible.
Apache Bench uses only one operating system thread irrespective of the concurrency level (specified by the -c flag). Therefore, when benchmarking high-capacity servers, a single instance of Apache Bench can itself be a bottleneck. To completely saturate the target URL, it is better to use additional instances of Apache Bench in parallel, if your server has multiple processor cores.
Precaution
You need to be aware that there is no directive in the Apache Bench to increase concurrency in particular intervals while running tests. Therefore, running load tests using ab is equivalent to a denial-of-service (DOS) attack. It is recommended that you inform and take prior permission from your VPS service provider if you are going to do heavy load testing for a long period of time. They will allot you an appropriate time interval or shift your node for the load testing task.
Second, if you are testing a third persons website continuously and for a long time just for learning Apache Bench from your VPS (which becomes the testing node), there is a remote possibility that your VPS public IP can be blocked by the third persons website permanently. In that case, you will not be able to connect to that website with the same IP. But if you really want to connect to the website in future, the only solution will be to talk to the system administrator of the target website, or create a new instance of the server with a different IP with the help of your VPS service provider.
Having warned you, let me assure you that all tests in this tutorial are safe enough and out of what system administrators generally call "system abuse" practices.
Apache Bench - Environment Setup
In this chapter, we will guide you how to set up your environment for Apache Bench on your VPS.
System Requirement
Memory − 128 MB
Disk Space − No minimum requirement
Operating System − No minimum requirement
Installing Apache Bench
Apache Bench is a stand-alone application, and has no dependencies on the Apache web server installation. The following is a two-step process to install Apache Bench.
Step 1 − Update package database.
# apt-get update
Please note that symbol # before a terminal command means that root user is issuing that command.
Step 2 − Install apache2 utils package to get access to Apache Bench.
# apt-get install apache2-utils
Apache Bench is now installed. If you want to test a web application hosted on the same VPS, then it is enough to install the Apache web server only −
# apt-get install apache2
Being an Apache utility, Apache Bench is automatically installed on installation of the Apache web server.
Verifying Apache Bench Installation
Let us now see how to verify Apache Bench Installation. The following code will help verify the installation −
# ab -V
Output
This is ApacheBench, Version 2.3 <$Revision: 1604373 $>
Copyright 1996 Adam Twiss, Zeus Technology Ltd, http://www.zeustech.net/
Licensed to The Apache Software Foundation, http://www.apache.org/
When you see the above terminal output, it means you have successfully installed Apache Bench.
Creating a Privileged Sudo User
From the safety point of view, it is considered a good practice for system administrator to create a sudo user instead of working as root. We will create a test user, named test, for the purpose −
# useradd -m -d /home/test -g sudo test
Let us set the password for the new user −
# passwd test
System will prompt for a new password for the user test. You can enter a simple password as we are just testing, and not deploying to the production server. Usually the sudo command will prompt you to provide the sudo user password; it is recommended not to use complicated password as the process becomes cumbersome.
Output
Enter new UNIX password:
Retype new UNIX password:
passwd: password updated successfully
Testing Apache.org Website
In this section, we will test the Apache.org Website. Let us first switch to the sudo user test −
# su test
To begin with, we will test the website of Apache organization, https://www.apache.org/. We will first run the command, and then understand the output −
$ ab -n 100 -c 10 https://www.apache.org/
Here -n is the number of requests to perform for the benchmarking session. The default is to just perform a single request which usually leads to non-representative benchmarking results.
And -c is the concurrency and denotes the number of multiple requests to perform at a time. Default is one request at a time.
So in this test, Apache Bench will make 100 requests with concurrency 10 to the Apache organization server.
Output
This is ApacheBench, Version 2.3 <$Revision: 1604373 $>
Copyright 1996 Adam Twiss, Zeus Technology Ltd, http://www.zeustech.net/
Licensed to The Apache Software Foundation, http://www.apache.org/

Benchmarking www.apache.org (be patient).....done

Server Software:        Apache/2.4.7
Server Hostname:        www.apache.org
Server Port:            443
SSL/TLS Protocol:       TLSv1.2,ECDHE-RSA-AES256-GCM-SHA384,2048,256

Document Path:          /
Document Length:        58769 bytes

Concurrency Level:      10
Time taken for tests:   1.004 seconds
Complete requests:      100
Failed requests:        0
Total transferred:      5911100 bytes
HTML transferred:       5876900 bytes
Requests per second:    99.56 [#/sec] (mean)
Time per request:       100.444 [ms] (mean)
Time per request:       10.044 [ms] (mean, across all concurrent requests)
Transfer rate:          5747.06 [Kbytes/sec] received

Connection Times (ms)
              min  mean[+/-sd] median   max
Connect:       39   46  30.9     41     263
Processing:    37   40  21.7     38     255
Waiting:       12   15  21.7     13     230
Total:         77   86  37.5     79     301

Percentage of the requests served within a certain time (ms)
  50%     79
  66%     79
  75%     80
  80%     80
  90%     82
  95%     84
  98%    296
  99%    301
 100%    301 (longest request)
Having run our first test, it will be easy to recognize the pattern of use for this command which is as follows −
# ab [options .....] URL
where,
ab − Apache Bench command
options − flags for particular task we want to perform
URL − path url we want to test
Understanding the Output Values
We need to understand the different metrics to understand the various output values returned by ab. Here goes the list −
Server Software − It is the name of the web server returned in the HTTP header of the first successful return.
Server Hostname − It is the DNS or IP address given on the command line.
Server Port − It is the port to which ab is connecting. If no port is given on the command line, this will default to 80 for http and 443 for https.
SSL/TLS Protocol − This is the protocol parameter negotiated between the client and server. This will only be printed if SSL is used.
Document Path − This is the request URI parsed from the command line string.
Document Length − It is the size in bytes of the first successfully returned document. If the document length changes during testing, the response is considered an error.
Concurrency Level − This is the number of concurrent clients (equivalent to web browsers) used during the test.
Time Taken for Tests − This is the time taken from the moment the first socket connection is created to the moment the last response is received.
Complete Requests − The number of successful responses received.
Failed Requests − The number of requests that were considered a failure. If the number is greater than zero, another line will be printed showing the number of requests that failed due to connecting, reading, incorrect content length, or exceptions.
Total Transferred − The total number of bytes received from the server. This number is essentially the number of bytes sent over the wire.
HTML Transferred − The total number of document bytes received from the server. This number excludes bytes received in HTTP headers
Requests per second − This is the number of requests per second. This value is the result of dividing the number of requests by the total time taken.
Time per request − The average time spent per request. The first value is calculated with the formula concurrency * timetaken * 1000 / done while the second value is calculated with the formula timetaken * 1000 / done
Transfer rate − The rate of transfer as calculated by the formula totalread / 1024 / timetaken.
Quick Analysis of the Load Testing Output
Having learned about the headings of the output values from the ab command, let us try to analyze and understand the output values for our initial test −
Apache organisation is using their own web Server Software − Apache (version 2.4.7)
Server is listening on Port 443 because of https. Had it been http, it would have been 80 (default).
Total data transferred is 58769 bytes for 100 requests.
Test completed in 1.004 seconds. There are no failed requests.
Requests per seconds − 99.56. This is considered a pretty good number.
Time per request − 100.444 ms (for 10 concurrent requests). So across all requests, it is 100.444 ms/10 = 10.044 ms.
Transfer rate − 1338.39 [Kbytes/sec] received.
In connection time statistics, you can observe that many requests had to wait for few seconds. This may be due to apache web server putting requests in wait queue.
In our first test, we had tested an application (i.e., www.apache.org) hosted on a different server. In the later part of the tutorial, we will be testing our sample web-applications hosted on the same server from which we will be running the ab tests. This is for the ease of learning and demonstration purpose. Ideally, the host node and testing node should be different for accurate measurement.
To better learn ab, you should compare and observe how the output values vary for different cases as we move forward in this tutorial.
Plotting the Output of Apache Bench
Here we will plot the relevant outcome to see how much time the server takes as the number of requests increases. For that, we will add the -g option in the previous command followed by the file name (here out.data) in which the ab output data will be saved −
$ ab -n 100 -c 10 -g out.data https://www.apache.org/
Let us now see the out.data before we create a plot −
$ less out.data
Output
starttime       seconds ctime   dtime   ttime   wait
Tue May 30 12:11:37 2017        1496160697      40      38      77      13
Tue May 30 12:11:37 2017        1496160697      42      38      79      13
Tue May 30 12:11:37 2017        1496160697      41      38      80      13
...
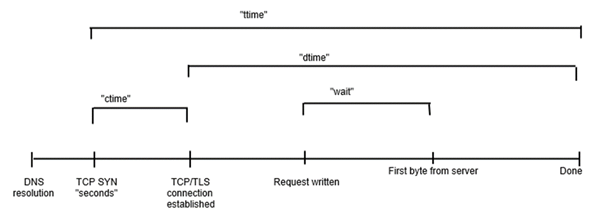
Let us now understand the column headers in the out.data file −
starttime − This is the date and time at which the call started.
seconds − Same as starttime but in the Unix timestamp format (date -d @1496160697 returns starttime output).
ctime − This is the Connection Time.
dtime − This is the Processing Time.
ttime − This is the Total Time (it is the sum of ctime and dtime, mathematically ttime = ctime + dtime).
wait − This is the Waiting Time.
For a pictorial visualization of how these multiple items are related to each other, take a look at the following image −
If we are working over terminal or where graphics are not available, gnuplot is a great option. We will quickly understand it by going through the following steps.
Let us install and launch gnuplot −
$ sudo apt-get install gnuplot
$ gnuplot
Output
G N U P L O T
Version 4.6 patchlevel 6    last modified September 2014
Build System: Linux x86_64

Copyright (C) 1986-1993, 1998, 2004, 2007-2014
Thomas Williams, Colin Kelley and many others

gnuplot home:     http://www.gnuplot.info
faq, bugs, etc:   type "help FAQ"
immediate help:   type "help"  (plot window: hit 'h')

Terminal type set to 'qt'
gnuplot>
As we are working over terminal and supposing that graphics are not available, we can choose the dumb terminal which will give output in ASCII over the terminal itself. This helps us get an idea what our plot looks like with this quick tool. Let us now prepare the terminal for ASCII plot.
gnuplot> set terminal dumb
Output
Terminal type set to 'dumb'
Options are 'feed  size 79, 24'
As, our gnuplot terminal is now ready for ASCII plot, let us plot the data from the out.data file −
gnuplot> plot "out.data" using 9 w l
Output
  1400 ++-----+------+-----+------+------+------+------+-----+------+-----++
       +      +      +     +      +      +      +"out.data" using 9 ****** +
       |                                                                   |
  1200 ++                       ********************************************
       |     *******************                                           |
  1000 ++    *                                                            ++
       |     *                                                             |
       |     *                                                             |
   800 ++   *                                                             ++
       |    *                                                              |
       |    *                                                              |
   600 ++   *                                                             ++
       |    *                                                              |
       |    *                                                              |
   400 ++   *                                                             ++
       |    *                                                              |
   200 ++   *                                                             ++
       |    *                                                              |
       +****  +      +     +      +      +      +      +     +      +      +
     0 ++-----+------+-----+------+------+------+------+-----+------+-----++
       0      10     20    30     40     50     60     70    80     90    100
We have plotted the ttime, total time (in ms) from column 9, with respect to the number of requests. We can notice that for the initial ten requests, the total time was in the nearly 100 ms, for next 30 requests (from 10th to 40th), it increased to 1100 ms, and so on. Your plot must be different depending on your out.data.
Testing Our Sample Application
In the previous chapter, we understood the basic use of the Apache Bench to test a third party website. In this section, we will use this tool to test a web application on our own server. To keep the tutorial self-contained to the extent possible, we have chosen to install a python application for the demonstration purpose; you can choose any other language like PHP or Ruby depending on your expertise level.
Installing Python
Generally, Python is installed by default on Linux servers.
Installing Bottle Framework and Creating a Simple Application
Bottle is a micro-framework written in python for creating web applications, and pip is a python package manager. Type the following command in terminal to install Bottle −
$ sudo apt-get install python-pip
$ sudo pip install bottle
Let us now create a small Bottle application. For that, create a directory and move inside it −
$ mkdir webapp
$ cd webapp
We will create a new python script, app.py, inside the webapp directory −
$ vim app.py
Now, write the following code in the app.py file −
from bottle import Bottle, run

app = Bottle()

@app.route('/')
@app.route('/hello')
def hello():
   return "Hello World!"

run(app, host = 'localhost', port = 8080)
When you have added the above lines, save and close the file. Having saved the file, we can run the python script to launch the application −
$ python app.py
Output
Bottle v0.12.7 server starting up (using WSGIRefServer())...
Listening on http://localhost:8080/
Hit Ctrl-C to quit.
This output shows that our application is running on the local machine at the host http://localhost and listening on the port 8080.
Let us check if our app is responding properly to the HTTP requests. As this terminal cannot take any input without quitting serving the Bottle application, we need to login to our VPS with another terminal. After logging into the VPS with another terminal, you can navigate to your application by typing the following code in the new terminal.
$ lynx http://localhost:8080/
Lynx is a command line browser and is usually installed by default in various Linux distributions like Debian and Ubuntu. If you see the following output, it means your app is working fine.
Output
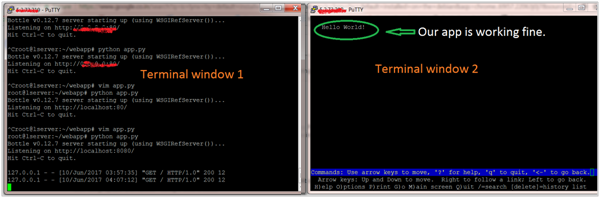
If you see the above output, that means our application is live and ready for testing.
Testing the Application with Developmental Web Server
Please note that there is a bug in ab, and it is not able to test the application on the localhost. So we will change the host from localhost to 127.0.0.1 in the app.py file. So the file will change to the following −
from bottle import Bottle, run

app = Bottle()

@app.route('/')
@app.route('/hello')
def hello():
   return "Hello World!"

run(app, host = '127.0.0.1', port = 8080)
Let us now test our app by typing the following command on the same terminal on which ran the lynx command −
$ ab -n 100 -c 10 http://127.0.0.1:8080/hello
Output
This is ApacheBench, Version 2.3 <$Revision: 1604373 $>
Copyright 1996 Adam Twiss, Zeus Technology Ltd, http://www.zeustech.net/
Licensed to The Apache Software Foundation, http://www.apache.org/

Benchmarking 127.0.0.1 (be patient).....done


Server Software:        WSGIServer/0.1
Server Hostname:        127.0.0.1
Server Port:            8080

Document Path:          /hello
Document Length:        12 bytes

Concurrency Level:      10
Time taken for tests:   0.203 seconds
Complete requests:      100
Failed requests:        0
Total transferred:      16500 bytes
HTML transferred:       1200 bytes
Requests per second:    493.78 [#/sec] (mean)
Time per request:       20.252 [ms] (mean)
Time per request:       2.025 [ms] (mean, across all concurrent requests)
Transfer rate:          79.56 [Kbytes/sec] received

Connection Times (ms)
              min  mean[+/-sd] median   max
Connect:        0    0   0.1      0       0
Processing:     1    6  28.2      2     202
Waiting:        1    6  28.2      2     202
Total:          1    6  28.2      2     202

Percentage of the requests served within a certain time (ms)
  50%      2
  66%      2
  75%      2
  80%      2
  90%      2
  95%      2
  98%    202
  99%    202
 100%    202 (longest request)
While the output on the first terminal will be (100 times) as follows −
...
127.0.0.1 - - [10/Jun/2017 04:30:26] "GET /hello HTTP/1.0" 200 12
127.0.0.1 - - [10/Jun/2017 04:30:26] "GET /hello HTTP/1.0" 200 12
127.0.0.1 - - [10/Jun/2017 04:30:26] "GET /hello HTTP/1.0" 200 12
...
You can observe how the various values of the ab outcome have changed as compared to the initial test.
Testing the Application with a Multi-Threaded Web Server
In the previous tests of ab, we have used the default web server bundled in the Bottle framework.
Now we will change the single-threaded default web server with a multi-threaded one. Therefore, let us install a multi-threaded web server library like cherrypy or gunicorn and tell Bottle to use it. We have chosen gunicorn for the demonstration purpose here (you can choose some other one too) −
$ sudo apt-get install gunicorn
And modify the file, that is change from the default web server to gunicorn −
...
run(server = 'gunicorn'...)
...
Let us test the app in the second terminal.
$ ab -n 100 -c 10 http://127.0.0.1:8080/hello
Output
This is ApacheBench, Version 2.3 <$Revision: 1604373 $>
Copyright 1996 Adam Twiss, Zeus Technology Ltd, http://www.zeustech.net/
Licensed to The Apache Software Foundation, http://www.apache.org/

Benchmarking 127.0.0.1 (be patient).....done


Server Software:        gunicorn/19.0.0
Server Hostname:        127.0.0.1
Server Port:            8080

Document Path:          /hello
Document Length:        12 bytes

Concurrency Level:      10
Time taken for tests:   0.031 seconds
Complete requests:      100
Failed requests:        0
Total transferred:      17200 bytes
HTML transferred:       1200 bytes
Requests per second:    3252.77 [#/sec] (mean)
Time per request:       3.074 [ms] (mean)
Time per request:       0.307 [ms] (mean, across all concurrent requests)
Transfer rate:          546.36 [Kbytes/sec] received

Connection Times (ms)
              min  mean[+/-sd] median   max
Connect:        0    1   0.9      0       4
Processing:     1    2   0.7      3       4
Waiting:        0    2   0.8      2       3
Total:          2    3   0.6      3       5
WARNING: The median and mean for the initial connection time are not within a normal
        deviation These results are probably not that reliable.
WARNING: The median and mean for the processing time are not within a normal deviation
        These results are probably not that reliable.

Percentage of the requests served within a certain time (ms)
  50%      3
  66%      3
  75%      3
  80%      3
  90%      4
  95%      5
  98%      5
  99%      5
 100%      5 (longest request)
Observe how the Requests per second increased from 493 to 3252. It means gunicorn is suitable as a production server for python apps.
Testing Multiple URLs Concurrently
In this chapter, we will learn how to test multiple URLs concurrently. For that, we will need to edit our application file, app.py to include two URLs −
from bottle import Bottle, run

app = Bottle()

@app.route('/')
@app.route('/hello1')
def hello():
   return "Hello World! It is first URL."

@app.route('/hello2')
def hello():
   return "Hello World! It is second URL."

run(app,server = 'gunicorn',host = '127.0.0.1', port = 8080)
Creating a Simple Shell Script
You can do this by creating a shell script, with multiple ab calls. Create a file test.sh and add the following lines to it −
ab -n 100 -c 10 http://127.0.0.1:8080/hello1
ab -n 100 -c 10 http://127.0.0.1:8080/hello2
When you have added the above lines, Save and Close the file. Make the file executable −
chmod u+x test.sh
Let us now run the script −
./test.sh
To avoid repetition and purpose of clarity, we will show only the relevant of the ab output, indicating by dots what portion has been omitted, as in the following.
Output
.
.
.
Document Path:          /hello1
Document Length:        732 bytes

Concurrency Level:      10
Time taken for tests:   0.040 seconds
Complete requests:      100
Failed requests:        0
Non-2xx responses:      100
Total transferred:      90000 bytes
HTML transferred:       73200 bytes
Requests per second:    2496.13 [#/sec] (mean)
Time per request:       4.006 [ms] (mean)
Time per request:       0.401 [ms] (mean, across all concurrent requests)
Transfer rate:          2193.87 [Kbytes/sec] received

Connection Times (ms)
              min  mean[+/-sd] median   max
Connect:        0    0   0.8      0       3
Processing:     1    3   1.0      4       5
Waiting:        0    3   1.2      4       4
Total:          1    4   0.6      4       5
WARNING: The median and mean for the processing time are not within a normal deviation
        These results are probably not that reliable.
.
.
.
Shell Script to Save the Apache Bench Output to a File
You can save the Apache Bench Output to file by creating a shell script, with multiple ab calls. At the end of each line, place an &; this makes the command run in the background, and lets the next command start its execution. You will also want to redirect the output to a file for each url using <filename>. For example, our file test.sh will look like the following after modification −
$ ab -n 100 -c 10 http://127.0.0.1:8080/hello1 > test1.txt &
$ ab -n 100 -c 10 http://127.0.0.1:8080/hello2 > test2.txt &
Here, test1.txt and test2.txt are the files to save the output data.
You can check that the above script has created two files, test1.txt and test2.txt which contains the ab output for the respective URLs −
$ ls -l
Output
...
-rw-r--r-- 1 root root  5225 May 30 12:11 out.data
-rwxr--r-- 1 root root   118 Jun 10 12:24 test.sh
-rw-r--r-- 1 root root  1291 Jun 10 12:31 test1.txt
-rwxr--r-- 1 root root    91 Jun 10 13:22 test2.sh
-rw-r--r-- 1 root root  1291 Jun 10 12:31 test2.txt
...
Watch-out Situation
While using ab, you should be alert to the failed test without warning. For example, if you check a wrong URL, you may get something similar to the following (we have deliberately changed the port here).
$ ab -l -r -n 100 -c 10 -k -H "Accept-Encoding: gzip, deflate" http://127.0.0.1:805/
Output
This is ApacheBench, Version 2.3 <$Revision: 1604373 $>
Copyright 1996 Adam Twiss, Zeus Technology Ltd, http://www.zeustech.net/
Licensed to The Apache Software Foundation, http://www.apache.org/

Benchmarking 127.0.0.1 (be patient).....done

Server Software:
Server Hostname:        127.0.0.1
Server Port:            805

Document Path:          /
Document Length:        Variable

Concurrency Level:      10
Time taken for tests:   0.002 seconds
Complete requests:      100
Failed requests:        150
   (Connect: 0, Receive: 100, Length: 0, Exceptions: 50)
Keep-Alive requests:    0
Total transferred:      0 bytes
HTML transferred:       0 bytes
Requests per second:    44984.26 [#/sec] (mean)
Time per request:       0.222 [ms] (mean)
Time per request:       0.022 [ms] (mean, across all concurrent requests)
Transfer rate:          0.00 [Kbytes/sec] received

Connection Times (ms)
              min  mean[+/-sd] median   max
Connect:        0    0   0.0      0       0
Processing:     0    0   0.2      0       0
Waiting:        0    0   0.0      0       0
Total:          0    0   0.2      0       0

Percentage of the requests served within a certain time (ms)
  50%      0
  66%      0
  75%      0
  80%      0
  90%      0
  95%      0
  98%      0
  99%      0
 100%      0 (longest request)
Preparation for Testing Dynamic Pages
In this chapter, we will understand the preparation required for testing dynamic pages. A server-side dynamic web page is a web page the construction of which is controlled by an application server processing server-side scripts. The apache bench can only load test the server-side dynamic web page.
Concurrency Level and the Total Number of Requests
Concurrency level should be lower than the total number of requests.
$ ab -l -r -n 30 -c 80 -k -H "Accept-Encoding: gzip, deflate" http://127.0.0.1:8000/
Output
ab: Cannot use concurrency level greater than total number of requests
Usage: ab [options] [http[s]://]hostname[:port]/path
Use of Flags
In this section, we will describe the use of some important flags with the ab command. We will use the terms, options and flags, interchangeably.
Verbose -v
The verbose option can be used to analyze and debug if there exist multiple number of failed requests. A common indication of failure of the load test is that the test finishes very fast and it gives a good number for request per second value. But it will be a wrong benchmark. To identify the success or failure, you can use the -v 2 option which will dump each responses body and header to the terminal output. Following command depicts a use case −
$ ab -n 1 -v 2 http://www.generic-example-URL.com/
Output
LOG: header received:
HTTP/1.0 200 OK

Content-Length: 2548687
Of course, if you are testing variable responses or returning non-200 HTTP codes in the event of any error, you should simply ignore length checking with the -l option. We will soon see non-200 HTTP when we will launch a web2py application in the subsequent chapters.
Keep-alive -k
When the client sends HTTP request, the connection is made to the server, the server sends the response, and the connection is closed after it has sent the request. This cycle continues with each request. However, with the keep-alive setting (also known as persistent connections), the client maintains an underlying TCP connection open to facilitate multiple requests and response; this eliminates the slow and costly connection initialization time that would otherwise be present.
Variable document length -l
If the web page is of variable length, then you should make use of the option -l. Apache Bench does not report errors if the length of the responses is not constant. This can be useful for dynamic pages.
Use of option -r
How to force ab not to exit on receiving errors? You should use the option -r. Without this option, your test may break as soon as any request hits the socket error. However, with this option, errors will be reported in the failed errors heading, but the test will continue till the end.
Use of option -H
This option is used to add arbitrary header line. The argument is typically in the form of a valid header line, containing a colon-separated field-value pair (i.e., Accept-Encoding: zip/zop;8bit).
Use of option -C
In the following section, we will learn in detail how to use the above options in combination with the option to use the cookie value, i.e., the -C option. The -C option is typically in the form of a name = value pair. This field can be repeated.
Using Session Cookie with Apache Bench
To understand how to use the cookie with Apache Bench, we need a web page that tries to set a cookie. A very good example is the web2py application which is a python web framework.
Installing web2py
We are going to quickly install another python app web2py. You can read more on how to use it on Web2py Framework Overview.
Python is generally installed by default on the Ubuntu and Debian server. Therefore, one requirement is already met to run web2py successfully.
However, we need to install the unzip package to extract the source files of web2py from the zip file which we will be downloading −
$ sudo apt-get update
$ sudo apt-get install unzip
Let us get the web2py framework from the projects website. We will download this to our home folder −
$cd ~
$ wget http://www.web2py.com/examples/static/web2py_src.zip
Now, we can unzip the file we just downloaded and move inside −
$ unzip web2py_src.zip
$ cd web2py
To run the web2py, you do not need to install it. Once you are inside the web2py directory, you can run it by typing the following command −
$python web2py.py
If everything is successful, you will see the following output where you will be asked to choose a password for the administrative UI −
web2py Web Framework
Created by Massimo Di Pierro, Copyright 2007-2017
Version 2.14.6-stable+timestamp.2016.05.10.00.21.47
Database drivers available: sqlite3, imaplib, pymysql, pg8000
WARNING:web2py:GUI not available because Tk library is not installed
choose a password:

please visit:
        http://127.0.0.1:8000/
use "kill -SIGTERM 23904" to shutdown the web2py server
However, you need to be aware of the fact that the launched web interface is accessible on the local machine only.
From the output, you can understand that to stop the web server, you will have to type CTRL-C in the instant terminal. On the other hand, to stop the web2py server on the other terminal related to the same VPS, you can insert the command kill -SIGTERM <PID>, where <PID> is the process ID for the web2py server, which in this case is 23904.
Session Cookie from web2py
If a page is only accessible by a logged in user, not directly accessible from the login page, in that case you can use the -C flag. This flag defines a cookie for the ab command. But you have to get the value of the session identifier cookie from a valid session. How to get that? Various online tutorials will guide you towards Chrome (or Mozilla) browser developer tools. But in our test case, as the application is available only on the command line, we will use the lynx browser to obtain the value.
Let us get the cookie value of a session first. Open another terminal and type the following command −
$ lynx http://127.0.0.1:8000/
In response to the above command, lynx will ask your permission to accept the cookie from the web2py server as shown in the image below.
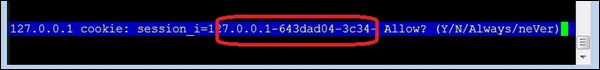
Note down the cookie value before typing y to accept the cookie. Now the terminal will look similar to the following image website on the terminal!
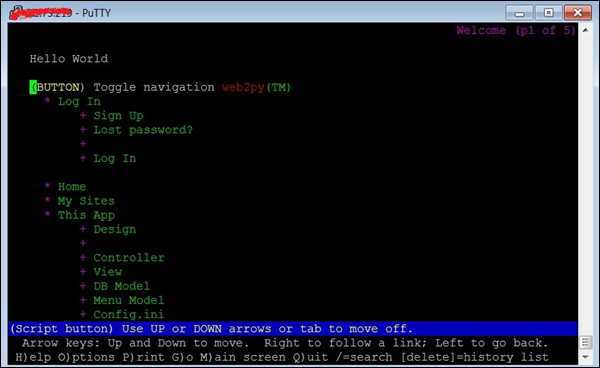
Having obtained the cookie value, we will now run the ab test. For that, we will have to open the third terminal (see the image below) −
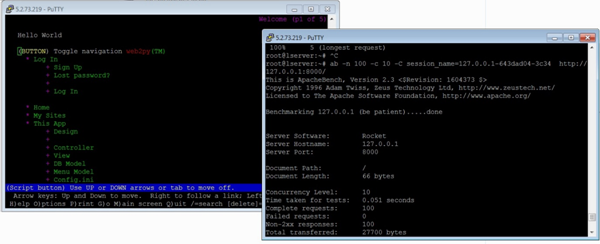
Now, let us use the -C flag in the third terminal −
$ ab -n 100 -c 10 -C session_name = 127.0.0.1-643dad04-3c34 http://127.0.0.1:8000/
Output
This is ApacheBench, Version 2.3 <$Revision: 1604373 $>
Copyright 1996 Adam Twiss, Zeus Technology Ltd, http://www.zeustech.net/
Licensed to The Apache Software Foundation, http://www.apache.org/

Benchmarking 127.0.0.1 (be patient).....done


Server Software:        Rocket
Server Hostname:        127.0.0.1
Server Port:            8000

Document Path:          /
Document Length:        66 bytes

Concurrency Level:      10
Time taken for tests:   0.051 seconds
Complete requests:      100
Failed requests:        0
Non-2xx responses:      100
Total transferred:      27700 bytes
HTML transferred:       6600 bytes
Requests per second:    1968.12 [#/sec] (mean)
Time per request:       5.081 [ms] (mean)
Time per request:       0.508 [ms] (mean, across all concurrent requests)
Transfer rate:          532.39 [Kbytes/sec] received

Connection Times (ms)
              min  mean[+/-sd] median   max
Connect:        1    2   0.9      2       4
Processing:     0    3   0.9      3       5
Waiting:        0    2   1.1      2       4
Total:          4    5   0.7      5       7

Percentage of the requests served within a certain time (ms)
  50%      5
  66%      5
  75%      5
  80%      6
  90%      6
  95%      6
  98%      7
  99%      7
 100%      7 (longest request)
From the output above, we note several points. First, web2py uses Rocket web server. We also note that we are getting Non-2xx responses in addition to previously discussed headings in the output. In general, Http protocol responds to a request using a response code, and anything within the 200s range means okay, and the rest corresponds to some problem. For example, 400s are resource related errors such as 404 File Not Found. 500s correspond to server errors. In our instant case, there is no error anywhere except when we are using the -C option. It can be suppressed using the -l option as already described.
Checking Admin Page
In this section, we will understand how to check the admin page. For the purpose of comparison, let us test another URL of the web2py application −
$ ab -n 100 -c 10 session_name = 127.0.0.1-643dad04-3c34 http://127.0.0.1:8000/admin
Output
This is ApacheBench, Version 2.3 <$Revision: 1604373 $>
Copyright 1996 Adam Twiss, Zeus Technology Ltd, http://www.zeustech.net/
Licensed to The Apache Software Foundation, http://www.apache.org/

Benchmarking 127.0.0.1 (be patient).....done


Server Software:        Rocket
Server Hostname:        127.0.0.1
Server Port:            8000

Document Path:          /admin
Document Length:        8840 bytes

Concurrency Level:      10
Time taken for tests:   2.077 seconds
Complete requests:      100
Failed requests:        0
Total transferred:      926700 bytes
HTML transferred:       884000 bytes
Requests per second:    48.14 [#/sec] (mean)
Time per request:       207.749 [ms] (mean)
Time per request:       20.775 [ms] (mean, across all concurrent requests)
Transfer rate:          435.61 [Kbytes/sec] received

Connection Times (ms)
          min  mean[+/-sd] median   max
Connect:        0    1   3.2      0      12
Processing:    62  204  52.2    199     400
Waiting:       61  203  52.0    199     400
Total:         62  205  54.3    199     411

Percentage of the requests served within a certain time (ms)
  50%    199
  66%    211
  75%    220
  80%    226
  90%    264
  95%    349
  98%    381
  99%    411
 100%    411 (longest request)
You should in particular note the respective statistics in section Connection Times and Percentage of the requests served of http://127.0.0.1:8000/ and http://127.0.0.1:8000/admin. There is a huge difference.
Using Timelimit Option
Generally, Timelimit option is a tricky one. Let us understand this from the manual of ab, which is quite explanatory −
-t timelimit
Maximum number of seconds to spend for benchmarking. This implies a -n 50000 internally.
Use this to benchmark the server within a fixed total amount of time.
Per default there is no timelimit.
Let us run a test with this option. We will note our observations after the going through the output −
$ ab -n 100 -c 10 -t 60 http://127.0.0.1:8000/
Output
This is ApacheBench, Version 2.3 <$Revision: 1604373 $>
Copyright 1996 Adam Twiss, Zeus Technology Ltd, http://www.zeustech.net/
Licensed to The Apache Software Foundation, http://www.apache.org/

Benchmarking 127.0.0.1 (be patient)
Completed 5000 requests
Completed 10000 requests
Completed 15000 requests
Completed 20000 requests
Completed 25000 requests
Completed 30000 requests
Completed 35000 requests
Completed 40000 requests
Completed 45000 requests
Completed 50000 requests
Finished 50000 requests


Server Software:        Rocket
Server Hostname:        127.0.0.1
Server Port:            8000

Document Path:          /
Document Length:        66 bytes

Concurrency Level:      10
Time taken for tests:   22.547 seconds
Complete requests:      50000
Failed requests:        0
Non-2xx responses:      50000
Total transferred:      13850000 bytes
HTML transferred:       3300000 bytes
Requests per second:    2217.61 [#/sec] (mean)
Time per request:       4.509 [ms] (mean)
Time per request:       0.451 [ms] (mean, across all concurrent requests)
Transfer rate:          599.88 [Kbytes/sec] received

Connection Times (ms)
              min  mean[+/-sd] median   max
Connect:        0    2   0.8      2       8
Processing:     0    2   3.2      2     218
Waiting:        0    2   3.2      2     218
Total:          2    4   3.1      4     220

Percentage of the requests served within a certain time (ms)
  50%      4
  66%      4
  75%      4
  80%      5
  90%      5
  95%      5
  98%      7
  99%      8
 100%    220 (longest request)
Notice that the output shows this option overrides the number of requests specified by the -n option and continues upto the 50K requests. However, as the requests were handled very fast, ab has terminated as soon as 50k mark was achieved within 22 seconds (see heading Time taken for tests) in the instant case.
You can test the same command replacing http://127.0.0.1:8000/ with http://127.0.0.1:8000/admin (assuming it is our web2py application) or a third party website like https://www.apache.org/, notice the difference in statistics.
Checklist Before Performing the Load Test
There are a few checks which will help you successfully run the test, and measure the performance accurately. Consider the following conditions before performing the load test −
Ensure that no extra python module is loaded.
To avoid TCP/IP Port Exhaustion, you should typically wait 2-3 minutes before you move to another ab test.
Ensure that the number of concurrent connections are lower than Apache Worker Threads.
You should reboot the server before performing another test, if Apache or python crashes.
Sequential Test Cases for Dynamic Pages
In this chapter, we will describe the various combinations of -n and -c with the important flags to gradually increase the load on your webserver.
You should mainly focus on how the following metrics change as you increase the load −
- Requests per second
- Connection Times (ms)
- Percentage of the requests served within a certain time (ms)
You should also notice for the threshold value when server starts getting stuck and you start getting failed requests.
1 Concurrent User Doing 100 Page Hits
Let us do 100 sequential page-loads by a single user −
$ ab -l -r -n 100 -c 1 -k -H "Accept-Encoding: gzip, deflate" http://127.0.0.1:8000/
Output
This is ApacheBench, Version 2.3 <$Revision: 1604373 $>
Copyright 1996 Adam Twiss, Zeus Technology Ltd, http://www.zeustech.net/
Licensed to The Apache Software Foundation, http://www.apache.org/

Benchmarking 127.0.0.1 (be patient).....done


Server Software:        Rocket
Server Hostname:        127.0.0.1
Server Port:            8000

Document Path:          /
Document Length:        Variable

Concurrency Level:      1
Time taken for tests:   0.045 seconds
Complete requests:      100
Failed requests:        0
Non-2xx responses:      100
Keep-Alive requests:    0
Total transferred:      27700 bytes
HTML transferred:       6600 bytes
Requests per second:    2206.24 [#/sec] (mean)
Time per request:       0.453 [ms] (mean)
Time per request:       0.453 [ms] (mean, across all concurrent requests)
Transfer rate:          596.80 [Kbytes/sec] received

Connection Times (ms)
              min  mean[+/-sd] median   max
Connect:        0    0   0.0      0       0
Processing:     0    0   0.0      0       0
Waiting:        0    0   0.0      0       0
Total:          0    0   0.0      0       1

Percentage of the requests served within a certain time (ms)
  50%      0
  66%      0
  75%      0
  80%      0
  90%      1
  95%      1
  98%      1
  99%      1
 100%      1 (longest request)
5 Concurrent Users Each Doing 10 Page Hits
This case corresponds to a peak load on a website that gets around 50,000+ hits a month.
$ ab -l -r -n 10 -c 5 -k -H "Accept-Encoding: gzip, deflate" http://127.0.0.1:8000/
In the following subsequent outputs, we will be omitting the common header for clarity purpose.
Output
...
Requests per second:    2009.24 [#/sec] (mean)
Time per request:       2.488 [ms] (mean)
Time per request:       0.498 [ms] (mean, across all concurrent requests)
Transfer rate:          543.52 [Kbytes/sec] received

Connection Times (ms)
              min  mean[+/-sd] median   max
Connect:        0    1   0.5      1       2
Processing:     0    1   0.5      1       2
Waiting:        0    1   0.5      1       1
Total:          2    2   0.4      3       3
ERROR: The median and mean for the total time are more than twice the standard
       deviation apart. These results are NOT reliable.

Percentage of the requests served within a certain time (ms)
  50%      3
  66%      3
  75%      3
  80%      3
  90%      3
  95%      3
  98%      3
  99%      3
 100%      3 (longest request)
10 Concurrent Users Each Doing 10 Page Hits
This test corresponds to 100 page loads by 10 different concurrent users, each user is doing 10 sequential pages loads.
$ ab -r -n 10 -c 10 -k -H "Accept-Encoding: gzip, deflate" http://127.0.0.1:8000/
Output
...
Requests per second:    2225.68 [#/sec] (mean)
Time per request:       4.493 [ms] (mean)
Time per request:       0.449 [ms] (mean, across all concurrent requests)
Transfer rate:          602.07 [Kbytes/sec] received

Connection Times (ms)
              min  mean[+/-sd] median   max
Connect:        1    2   0.7      2       3
Processing:     0    2   1.0      2       3
Waiting:        0    1   1.0      2       3
Total:          4    4   0.3      4       4
WARNING: The median and mean for the waiting time are not within a normal deviation
        These results are probably not that reliable.

Percentage of the requests served within a certain time (ms)
  50%      4
  66%      4
  75%      4
  80%      4
  90%      4
  95%      4
  98%      4
  99%      4
 100%      4 (longest request)
20 Concurrent Users Each Doing 20 Page Hits
This test corresponds to 400 page loads by 20 different concurrent users, each user is doing 20 sequential pages loads.
$ ab -r -n 20 -c 20 -k -H Accept-Encoding: gzip, deflate http://127.0.0.1:8000/
Output
...
Requests per second:    1619.96 [#/sec] (mean)
Time per request:       12.346 [ms] (mean)
Time per request:       0.617 [ms] (mean, across all concurrent requests)
Transfer rate:          438.21 [Kbytes/sec] received

Connection Times (ms)
              min  mean[+/-sd] median   max
Connect:        2    6   2.3      6      10
Processing:     1    5   2.9      5      10
Waiting:        0    5   2.9      5       9
Total:         10   11   0.6     11      12

Percentage of the requests served within a certain time (ms)
  50%     11
  66%     11
  75%     12
  80%     12
  90%     12
  95%     12
  98%     12
  99%     12
 100%     12 (longest request)
30 Concurrent Users Each Doing 30 Page Hits
This test corresponds to 900 page loads by 30 different concurrent users, each user is doing 30 sequential pages loads.
$ ab -r -n 30 -c 30 -k -H "Accept-Encoding: gzip, deflate" http://127.0.0.1:8000/
Output
...
Requests per second:    2283.45 [#/sec] (mean)
Time per request:       13.138 [ms] (mean)
Time per request:       0.438 [ms] (mean, across all concurrent requests)
Transfer rate:          617.69 [Kbytes/sec] received

Connection Times (ms)
              min  mean[+/-sd] median   max
Connect:        2    6   2.7      6      11
Processing:     1    6   3.1      6      11
Waiting:        0    5   3.2      5      10
Total:         11   12   0.5     12      13

Percentage of the requests served within a certain time (ms)
  50%     12
  66%     12
  75%     12
  80%     12
  90%     13
  95%     13
  98%     13
  99%     13
 100%     13 (longest request)
We have now learned how to increase the load gradually on the website and test its performance.
Apache Bench - Comparison of Outputs
In this chapter, we will compare the outputs with and without flags. Let us see how the use of appropriate flags can increase the performance of your web application. Before that, we need to understand how if your application is simple then you may not notice the difference. As is the case with our simple application, with flags and without flags. Then we will perform the same test with https://www.apache.org/ URL, and see the difference.
Testing our Application without Flags
In this section, we will understand how to test our application without flags.
$ ab -n 100 -c 10 http://127.0.0.1:8000/
Output
This is ApacheBench, Version 2.3 <$Revision: 1604373 $>
Copyright 1996 Adam Twiss, Zeus Technology Ltd, http://www.zeustech.net/
Licensed to The Apache Software Foundation, http://www.apache.org/

Benchmarking 127.0.0.1 (be patient).....done


Server Software:        Rocket
Server Hostname:        127.0.0.1
Server Port:            8000

Document Path:          /
Document Length:        Variable

Concurrency Level:      10
Time taken for tests:   0.244 seconds
Complete requests:      100
Failed requests:        0
Non-2xx responses:      100
Keep-Alive requests:    0
Total transferred:      27700 bytes
HTML transferred:       6600 bytes
Requests per second:    2208.77 [#/sec] (mean)
Time per request:       4.527 [ms] (mean)
Time per request:       0.453 [ms] (mean, across all concurrent requests)
Transfer rate:          597.49 [Kbytes/sec] received

Connection Times (ms)
              min  mean[+/-sd] median   max
Connect:        1    2   0.7      2       3
Processing:     0    2   0.7      2       4
Waiting:        0    2   1.0      2       3
Total:          4    4   0.3      4       5

Percentage of the requests served within a certain time (ms)
  50%      4
  66%      4
  75%      5
  80%      5
  90%      5
  95%      5
  98%      5
  99%      5
 100%      5 (longest request)
Testing our Application with Flags
In this section, we will understand how to test our application with flags.
$ ab -l -r -n 100 -c 10 -k -H "Accept-Encoding: gzip, deflate" http://127.0.0.1:8000/
Output
...
Requests per second:    2277.07 [#/sec] (mean)
Time per request:       4.392 [ms] (mean)
Time per request:       0.439 [ms] (mean, across all concurrent requests)
Transfer rate:          615.97 [Kbytes/sec] received

Connection Times (ms)
              min  mean[+/-sd] median   max
Connect:        1    2   0.7      2       3
Processing:     0    2   0.7      2       4
Waiting:        0    2   1.0      2       3
Total:          4    4   0.2      4       5

Percentage of the requests served within a certain time (ms)
  50%      4
  66%      4
  75%      4
  80%      4
  90%      5
  95%      5
  98%      5
  99%      5
 100%      5 (longest request)
We can simply note that there is not much difference between the output statistics.
Testing Apache Organisation Website without Flags
Let us now see how to test the Apache Organisation Website without flags.
$ ab -n 100 -c 10 http://www.apache.org/
Output
This is ApacheBench, Version 2.3 <$Revision: 1604373 $>
Copyright 1996 Adam Twiss, Zeus Technology Ltd, http://www.zeustech.net/
Licensed to The Apache Software Foundation, http://www.apache.org/

Benchmarking www.apache.org (be patient).....done

Server Software:        Apache/2.4.7
Server Hostname:        www.apache.org
Server Port:            80

Document Path:          /
Document Length:        58433 bytes

Concurrency Level:      10
Time taken for tests:   1.498 seconds
Complete requests:      100
Failed requests:        0
Total transferred:      5877500 bytes
HTML transferred:       5843300 bytes
Requests per second:    66.74 [#/sec] (mean)
Time per request:       149.840 [ms] (mean)
Time per request:       14.984 [ms] (mean, across all concurrent requests)
Transfer rate:          3830.58 [Kbytes/sec] received

Connection Times (ms)
              min  mean[+/-sd] median   max
Connect:       12  110 295.2     12    1012
Processing:    37   38   0.5     38      39
Waiting:       12   13   0.3     13      15
Total:         49  147 295.4     50    1051

Percentage of the requests served within a certain time (ms)
  50%     50
  66%     50
  75%     50
  80%     50
  90%    816
  95%   1050
  98%   1051
  99%   1051
 100%   1051 (longest request)
Testing Apache Organisation Website with Flags
Let us now test the Apache Organisation Website with Flags.
$ ab -l -r -n 100 -c 10 -k -H "Accept-Encoding: gzip, deflate" http://www.apache.org/
Output
...
Document Length:        Variable

Concurrency Level:      10
Time taken for tests:   0.357 seconds
Complete requests:      100
Failed requests:        0
Keep-Alive requests:    100
Total transferred:      1358510 bytes
HTML transferred:       1317700 bytes
Requests per second:    280.28 [#/sec] (mean)
Time per request:       35.678 [ms] (mean)
Time per request:       3.568 [ms] (mean, across all concurrent requests)
Transfer rate:          3718.41 [Kbytes/sec] received

Connection Times (ms)
              min  mean[+/-sd] median   max
Connect:        0    1   3.7      0      12
Processing:    14   17  21.3     15     227
Waiting:       14   17  21.3     14     227
Total:         14   18  21.5     15     227

Percentage of the requests served within a certain time (ms)
  50%     15
  66%     15
  75%     15
  80%     15
  90%     27
  95%     28
  98%     29
  99%    227
 100%    227 (longest request)
You can simply note how the request per second increased with the use of flags. In the instant case, it is particularly due to use of -H "Accept-Encoding: gzip, deflate because this flag tells the Apache server to serve requests in gzipped format.
Considering the Apache Bench Results
A few important points need to be considered when it comes to the Apache Bench results. This will help us design our overall strategy to remove the bottlenecks in our application and improve its performance.
We need to Requests Per Second. This gives us an idea of how well our web server set-up is working; the larger the number, the better the performance. Then comes the Connection Times (ms) and the Percentage of the requests served. You may have to tweak the settings of your web server to change these metrics to your desired performance.
Check if there are errors in the Apaches or the used web server error logs or (general) logs. As you will increase your load, things will start to choke: memory issues will start coming up. A lot of python scripts will begin to crash if they are not written with concurrency in mind.
You need to find out what is the critical concurrency value above which your web server crashes and/or times-out? Normally this should happen at a fairly high concurrency level. If this value is low, something is wrong and you need to adjust these settings lower/higher.
Conclusion
In this tutorial we learned how Apache Bench can be used to load test any web site or web application. Apache Bench can be a very valuable tool for determining how your web application server setup should be improved, to reduce bottlenecks and increase performance. Now that you are familiar with the basic usage of Apache Bench, you can start by creating new test plans to measure the performance of your applications in various scenarios.
