- Angular Highcharts - Home
- Angular Highcharts - Overview
- Environment Setup
- Configuration Syntax
- Angular Highcharts - Line Charts
- Angular Highcharts - Area Charts
- Angular Highcharts - Bar Charts
- Angular Highcharts - Column Charts
- Angular Highcharts - Pie Charts
- Angular Highcharts - Scatter Chart
- Angular Highcharts - Dynamic Charts
- Angular Highcharts - Combinations
- Angular Highcharts - 3D Charts
- Angular Highcharts - Map Charts
Selected Reading
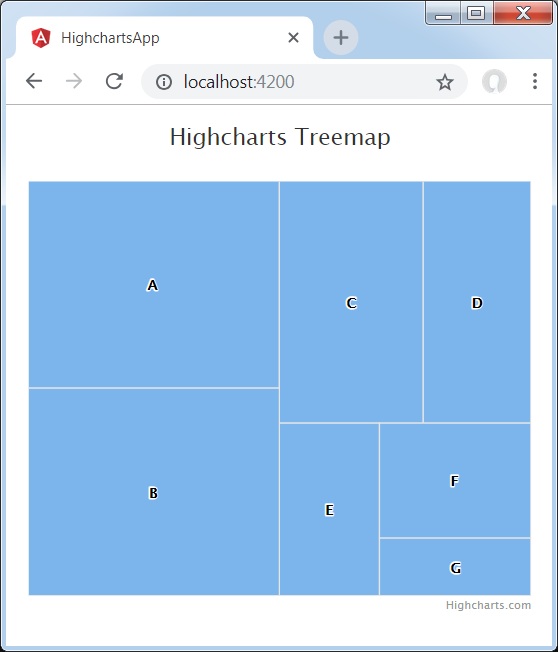
Angular Highcharts - Tree Map Chart
Following is an example of a Tree Map Chart.
We have already seen the configuration used to draw a chart in Highcharts Configuration Syntax chapter.
An example of a Tree Map Chart is given below.
Configurations
Let us now see the additional configurations/steps taken.
series
Configure the chart type to be 'treemap' based. series.type decides the series type for the chart. Here, the default value is "line".
series : [{type: "treemap"}]
Example
app.component.ts
import { Component } from '@angular/core';
import * as Highcharts from 'highcharts';
import * as highchartsTreemap from 'highcharts/modules/treemap';
highchartsTreemap(Highcharts);
@Component({
   selector: 'app-root',
   templateUrl: './app.component.html',
   styleUrls: ['./app.component.css']
})
export class AppComponent {
   highcharts = Highcharts;
   chartOptions = {
      title : {
         text: 'Highcharts Treemap'
      },
      colorAxis : {
         minColor: '#FFFFFF',
         maxColor: Highcharts.getOptions().colors[0]
      },
      series : [{
         type: "treemap",
         layoutAlgorithm: 'squarified',
         data: [
         {
            name: 'A',
            value: 6,
            colorValue: 1
         },
         {
            name: 'B',
            value: 6,
            colorValue: 2
         },
         {
            name: 'C',
            value: 4,
            colorValue: 3
         },
         {
            name: 'D',
            value: 3,
            colorValue: 4
         },
         {
            name: 'E',
            value: 2,
            colorValue: 5
         },
         {
            name: 'F',
            value: 2,
            colorValue: 6
         },
         {
            name: 'G',
            value: 1,
            colorValue: 7
         }
         ]
      }]
   };
}
Result
Verify the result.
angular_highcharts_map_charts.htm

Advertisements