- Angular Highcharts - Home
- Angular Highcharts - Overview
- Environment Setup
- Configuration Syntax
- Angular Highcharts - Line Charts
- Angular Highcharts - Area Charts
- Angular Highcharts - Bar Charts
- Angular Highcharts - Column Charts
- Angular Highcharts - Pie Charts
- Angular Highcharts - Scatter Chart
- Angular Highcharts - Dynamic Charts
- Angular Highcharts - Combinations
- Angular Highcharts - 3D Charts
- Angular Highcharts - Map Charts
Angular Highcharts - Configuration Syntax
In this chapter, we will showcase the configuration required to draw a chart using the Highcharts API in Angular.
Step 1 - Create Angular Application
Follow the following steps to update the Angular application we created in Angular 6 - Project Setup chapter −
| Step | Description |
|---|---|
| 1 | Create a project with a name highchartsApp as explained in the Angular 6 - Project Setup chapter. |
| 2 | Modify app.module.ts, app.component.ts and app.component.html as explained below. Keep rest of the files unchanged. |
| 3 | Compile and run the application to verify the result of the implemented logic. |
Following is the content of the modified module descriptor app.module.ts.
import { BrowserModule } from '@angular/platform-browser';
import { NgModule } from '@angular/core';
import { AppComponent } from './app.component';
import { HighchartsChartComponent } from 'highcharts-angular';
@NgModule({
   declarations: [
      AppComponent,
      HighchartsChartComponent
   ],
   imports: [
      BrowserModule,
   ],
   providers: [],
   bootstrap: [AppComponent]
})
export class AppModule { }
Following is the content of the modified HTML host file app.component.html.
<highcharts-chart
   [Highcharts] = "highcharts"
   [options] = "chartOptions"
   style = "width: 100%; height: 400px; display: block;">
</highcharts-chart>
We'll see the updated app.component.ts in the end after understanding configurations.
Step 2 − Use Configurations
Create Highcharts and create chartOptions
highcharts = Highcharts;
   chartOptions = {
}
Create Chart
Configure the type, title and sub-title of the chart using chartOptions.
chart: {
   type: "spline"
},
xAxis
Configure the ticker to be displayed on the X-Axis using chartOptions.
xAxis:{
   categories:["Jan", "Feb", "Mar", "Apr", "May", "Jun", "Jul", "Aug", "Sep", "Oct", "Nov", "Dec"]
},
yAxis
Configure the title to be displayed on the Y-Axis using chartOptions.
yAxis: {
   title:{
      text:"Temperature °C"
   }
},
tooltip
Configure the tooltip. Put suffix to be added after value (y-axis) using chartOptions.
tooltip: {
   valueSuffix:" °C"
},
series
Configure the data to be displayed on the chart using chartOptions. Series is an array where each element of this array represents a single line on the chart.
series: [
   {
      name: 'Tokyo',
      data: [7.0, 6.9, 9.5, 14.5, 18.2, 21.5, 25.2,26.5, 23.3, 18.3, 13.9, 9.6]
   },
   {
      name: 'New York',
      data: [-0.2, 0.8, 5.7, 11.3, 17.0, 22.0, 24.8,24.1, 20.1, 14.1, 8.6, 2.5]
   },
   {
      name: 'Berlin',
      data: [-0.9, 0.6, 3.5, 8.4, 13.5, 17.0, 18.6, 17.9, 14.3, 9.0, 3.9, 1.0]
   },
   {
      name: 'London',
      data: [3.9, 4.2, 5.7, 8.5, 11.9, 15.2, 17.0, 16.6, 14.2, 10.3, 6.6, 4.8]
   }
]
Example
Consider the following example to further understand the Configuration Syntax −
app.component.ts
import { Component } from '@angular/core';
import * as Highcharts from 'highcharts';
@Component({
selector: 'app-root',
templateUrl: './app.component.html',
styleUrls: ['./app.component.css']
})
export class AppComponent {
highcharts = Highcharts;
chartOptions = {
chart: {
type: "spline"
},
title: {
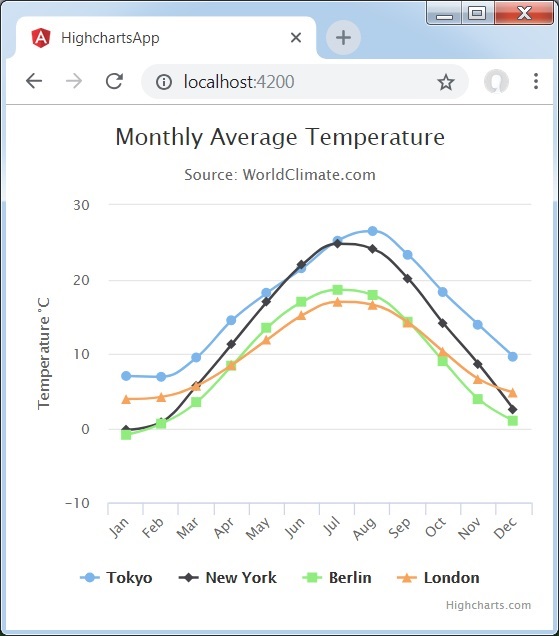
text: "Monthly Average Temperature"
},
subtitle: {
text: "Source: WorldClimate.com"
},
xAxis:{
categories:["Jan", "Feb", "Mar", "Apr", "May", "Jun",
"Jul", "Aug", "Sep", "Oct", "Nov", "Dec"]
},
yAxis: {
title:{
text:"Temperature °C"
}
},
tooltip: {
valueSuffix:" °C"
},
series: [
{
name: 'Tokyo',
data: [7.0, 6.9, 9.5, 14.5, 18.2, 21.5, 25.2,26.5, 23.3, 18.3, 13.9, 9.6]
},
{
name: 'New York',
data: [-0.2, 0.8, 5.7, 11.3, 17.0, 22.0, 24.8,24.1, 20.1, 14.1, 8.6, 2.5]
},
{
name: 'Berlin',
data: [-0.9, 0.6, 3.5, 8.4, 13.5, 17.0, 18.6, 17.9, 14.3, 9.0, 3.9, 1.0]
},
{
name: 'London',
data: [3.9, 4.2, 5.7, 8.5, 11.9, 15.2, 17.0, 16.6, 14.2, 10.3, 6.6, 4.8]
}
]
};
}
Result
Verify the result.