- Angular Highcharts - Home
- Angular Highcharts - Overview
- Environment Setup
- Configuration Syntax
- Angular Highcharts - Line Charts
- Angular Highcharts - Area Charts
- Angular Highcharts - Bar Charts
- Angular Highcharts - Column Charts
- Angular Highcharts - Pie Charts
- Angular Highcharts - Scatter Chart
- Angular Highcharts - Dynamic Charts
- Angular Highcharts - Combinations
- Angular Highcharts - 3D Charts
- Angular Highcharts - Map Charts
Selected Reading
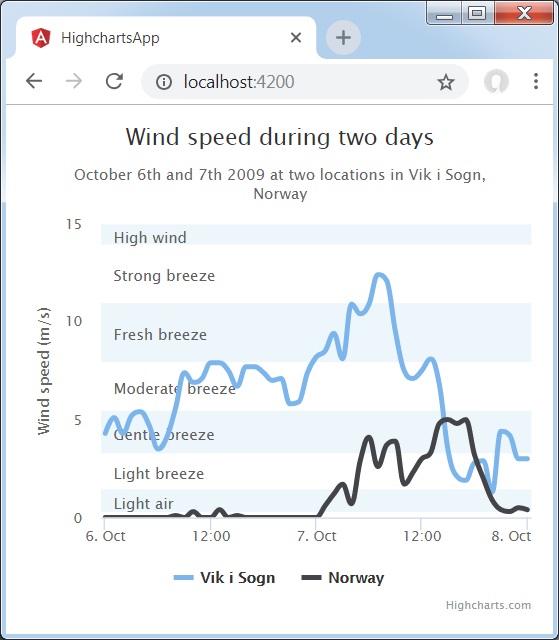
Spline chart with Plot Bands
Following is an example of a spline chart with plot bands.
We have already seen the configuration used to draw a chart in Highcharts Configuration Syntax chapter. Now, let us understand an example of a spline chart with plot bands where additional configurations/steps are taken.
Configurations
Configure the bands using the yAxis.plotBands property. Set the band range using the 'from' and 'to' property. Set the color of band using the 'color' property. Style the label of band using the 'label' property.
yAxis
var yAxis = {
   title: {
      text: 'Wind speed (m/s)'
   },
   min: 0,
   minorGridLineWidth: 0,
   gridLineWidth: 0,
   alternateGridColor: null,
   plotBands: [
      { // Light air
         from: 0.3,
         to: 1.5,
         color: 'rgba(68, 170, 213, 0.1)',

         label: {
            text: 'Light air',
            style: {
               color: '#606060'
            }
         }
      },
      { // Light breeze
         from: 1.5,
         to: 3.3,
         color: 'rgba(0, 0, 0, 0)',

         label: {
            text: 'Light breeze',
            style: {
               color: '#606060'
            }
         }
      },
      { // Gentle breeze
         from: 3.3,
         to: 5.5,
         color: 'rgba(68, 170, 213, 0.1)',

         label: {
            text: 'Gentle breeze',
            style: {
               color: '#606060'
            }
         }
      },
      { // Moderate breeze
         from: 5.5,
         to: 8,
         color: 'rgba(0, 0, 0, 0)',

         label: {
            text: 'Moderate breeze',
            style: {
               color: '#606060'
            }
         }
      },
      { // Fresh breeze
         from: 8,
         to: 11,
         color: 'rgba(68, 170, 213, 0.1)',

         label: {
            text: 'Fresh breeze',
            style: {
               color: '#606060'
            }
         }
      },
      { // Strong breeze
         from: 11,
         to: 14,
         color: 'rgba(0, 0, 0, 0)',

         label: {
            text: 'Strong breeze',
            style: {
               color: '#606060'
            }
         }
      },
      { // High wind
         from: 14,
         to: 15,
         color: 'rgba(68, 170, 213, 0.1)',

         label: {
            text: 'High wind',
            style: {
               color: '#606060'
            }
         }
      }
   ]
};
Example
app.component.ts
import { Component } from '@angular/core';
import * as Highcharts from 'highcharts';
import * as highchartsTreemap from 'highcharts/modules/treemap';
highchartsTreemap(Highcharts);
@Component({
  selector: 'app-root',
  templateUrl: './app.component.html',
  styleUrls: ['./app.component.css']
})
export class AppComponent {
   highcharts = Highcharts;
   chartOptions = {
      chart : {
         type: 'spline'
      },
      title : {
         text: 'Wind speed during two days'
      },
      subtitle : {
         text: 'October 6th and 7th 2009 at two locations in Vik i Sogn, Norway'
      },
      xAxis : {
         type: 'datetime',
         labels: {
            overflow: 'justify'
         }
      },
      yAxis : {
         title: {
            text: 'Wind speed (m/s)'
         },
         min: 0,
         minorGridLineWidth: 0,
         gridLineWidth: 0,
         alternateGridColor: null,
         plotBands: [
            { // Light air
               from: 0.3,
               to: 1.5,
               color: 'rgba(68, 170, 213, 0.1)',
               label: {
                  text: 'Light air',
                  style: {
                     color: '#606060'
                  }
               }
            },
            { // Light breeze
               from: 1.5,
               to: 3.3,
               color: 'rgba(0, 0, 0, 0)',
               label: {
                  text: 'Light breeze',
                  style: {
                     color: '#606060'
                  }
               }
            },
            { // Gentle breeze
               from: 3.3,
               to: 5.5,
               color: 'rgba(68, 170, 213, 0.1)',
               label: {
                  text: 'Gentle breeze',
                  style: {
                     color: '#606060'
                  }
               }
            },
            { // Moderate breeze
               from: 5.5,
               to: 8,
               color: 'rgba(0, 0, 0, 0)',
               label: {
                  text: 'Moderate breeze',
                  style: {
                     color: '#606060'
                  }
               }
            },
            { // Fresh breeze
               from: 8,
               to: 11,
               color: 'rgba(68, 170, 213, 0.1)',
               label: {
                  text: 'Fresh breeze',
                  style: {
                     color: '#606060'
                  }
               }
            },
            { // Strong breeze
               from: 11,
               to: 14,
               color: 'rgba(0, 0, 0, 0)',
               label: {
                  text: 'Strong breeze',
                  style: {
                     color: '#606060'
                  }
               }
            },
            { // High wind
               from: 14,
               to: 15,
               color: 'rgba(68, 170, 213, 0.1)',
               label: {
                  text: 'High wind',
                  style: {
                     color: '#606060'
                  }
               }
            }
         ]
      },
      tooltip : {
         valueSuffix: ' m/s'
      },
      plotOptions : {
         spline: {
            lineWidth: 4,
            states: {
               hover: {
                  lineWidth: 5
               }
            },
            marker: {
               enabled: false
            },
            pointInterval: 3600000, // one hour
            pointStart: Date.UTC(2009, 9, 6, 0, 0, 0)
         }
      },
      series : [
         {
            name: 'Vik i Sogn',
            data: [4.3, 5.1, 4.3, 5.2, 5.4, 4.7, 3.5, 4.1, 5.6, 7.4, 6.9, 7.1,
               7.9, 7.9, 7.5, 6.7, 7.7, 7.7, 7.4, 7.0, 7.1, 5.8, 5.9, 7.4,
               8.2, 8.5, 9.4, 8.1, 10.9, 10.4, 10.9, 12.4, 12.1, 9.5, 7.5,
               7.1, 7.5, 8.1, 6.8, 3.4, 2.1, 1.9, 2.8, 2.9, 1.3, 4.4, 4.2,
               3.0, 3.0]
         },
         {
            name: 'Norway',
            data: [0.0, 0.0, 0.0, 0.0, 0.0, 0.0, 0.0, 0.0, 0.1, 0.0, 0.3, 0.0,
               0.0, 0.4, 0.0, 0.1, 0.0, 0.0, 0.0, 0.0, 0.0, 0.0, 0.0, 0.0,
               0.0, 0.6, 1.2, 1.7, 0.7, 2.9, 4.1, 2.6, 3.7, 3.9, 1.7, 2.3,
               3.0, 3.3, 4.8, 5.0, 4.8, 5.0, 3.2, 2.0, 0.9, 0.4, 0.3, 0.5, 0.4]
         }
      ],
      navigation : {
         menuItemStyle: {
            fontSize: '10px'
         }
      }
   };
}
Result
Verify the result.
angular_highcharts_line_charts.htm

Advertisements