- Angular Highcharts - Home
- Angular Highcharts - Overview
- Environment Setup
- Configuration Syntax
- Angular Highcharts - Line Charts
- Angular Highcharts - Area Charts
- Angular Highcharts - Bar Charts
- Angular Highcharts - Column Charts
- Angular Highcharts - Pie Charts
- Angular Highcharts - Scatter Chart
- Angular Highcharts - Dynamic Charts
- Angular Highcharts - Combinations
- Angular Highcharts - 3D Charts
- Angular Highcharts - Map Charts
Selected Reading
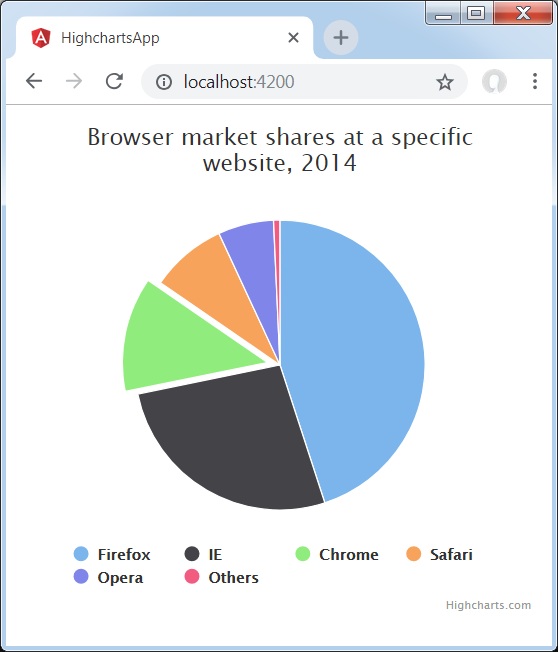
Angular Highcharts - Pie Chart with Legends
Following is an example of a Pie Chart with Legends.
We have already seen the configurations used to draw a chart in Highcharts Configuration Syntax chapter.
An example of a Pie Chart with Legends is given below.
Configurations
Let us now see the additional configurations/steps taken.
chart
Configure the chart type to be 'pie' based. chart.type decides the series type for the chart. Here, the default value is "line".
var series = {
   type: 'pie'
};
plotOptions
Configure the plotOptions to have legends in pie chart using plotOptions.pie.showInLegend attribute.
plotOptions : {
   pie: {
      allowPointSelect: true,
      cursor: 'pointer',
      dataLabels: {
         enabled: false
      },
      showInLegend: true
   }
}
Example
app.component.ts
import { Component } from '@angular/core';
import * as Highcharts from 'highcharts';
@Component({
  selector: 'app-root',
  templateUrl: './app.component.html',
  styleUrls: ['./app.component.css']
})
export class AppComponent {
   highcharts = Highcharts;
   chartOptions = {
      chart : {
         plotBorderWidth: null,
         plotShadow: false
      },
      title : {
         text: 'Browser market shares at a specific website, 2014'
      },
      tooltip : {
         pointFormat: '{series.name}: <b>{point.percentage:.1f}%</b>'
      },
      plotOptions : {
         pie: {
            allowPointSelect: true,
            cursor: 'pointer',

            dataLabels: {
               enabled: false
            },

            showInLegend: true
         }
      },
      series : [{
         type: 'pie',
         name: 'Browser share',
         data: [
            ['Firefox',   45.0],
            ['IE',       26.8],
            {
               name: 'Chrome',
               y: 12.8,
               sliced: true,
               selected: true
            },
            ['Safari',    8.5],
            ['Opera',     6.2],
            ['Others',      0.7]
         ]
      }]
   };
}
Result
Verify the result.
angular_highcharts_pie_charts.htm

Advertisements