- Angular Highcharts - Home
- Angular Highcharts - Overview
- Environment Setup
- Configuration Syntax
- Angular Highcharts - Line Charts
- Angular Highcharts - Area Charts
- Angular Highcharts - Bar Charts
- Angular Highcharts - Column Charts
- Angular Highcharts - Pie Charts
- Angular Highcharts - Scatter Chart
- Angular Highcharts - Dynamic Charts
- Angular Highcharts - Combinations
- Angular Highcharts - 3D Charts
- Angular Highcharts - Map Charts
Selected Reading
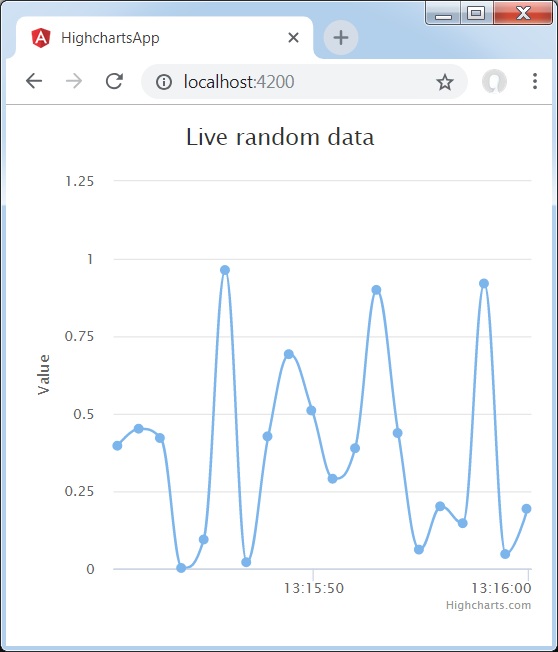
Spline updating each second
We have already seen the configuration used to draw a chart in Highcharts Configuration Syntax chapter.
An example of a Spline Chart updating each second is given below.
Configurations
Let us now see the additional configurations/steps taken.
series.addPoint
Add a new point created randomly to the series at an interval of 1000 milliseconds.
events: {
   load: function () {
      // set up the updating of the chart each second
      var series = this.series[0];
      setInterval(function () {
         var x = (new Date()).getTime(), // current time
         y = Math.random();
         series.addPoint([x, y], true, true);
      }, 1000);
   }
}
Example
app.component.ts
import { Component } from '@angular/core';
import * as Highcharts from 'highcharts';
@Component({
  selector: 'app-root',
  templateUrl: './app.component.html',
  styleUrls: ['./app.component.css']
})
export class AppComponent {
   highcharts = Highcharts;
   chartOptions = {
      chart : {
         type: 'spline',
         animation: Highcharts.svg, // don't animate in IE < IE 10.
         marginRight: 10,
         events: {
            load: function () {
               // set up the updating of the chart each second
               var series = this.series[0];
               setInterval(function () {
                  var x = (new Date()).getTime(), // current time
                  y = Math.random();
                  series.addPoint([x, y], true, true);
               }, 1000);
            }
         }
      },
      title : {
         text: 'Live random data'
      },
      xAxis : {
         type: 'datetime',
         tickPixelInterval: 150
      },
      yAxis : {
         title: {
            text: 'Value'
         },
         plotLines: [{
            value: 0,
            width: 1,
            color: '#808080'
         }]
      },
      tooltip: {
         formatter: function () {
            return '<b>' + this.series.name + '</b><br/>' +
            Highcharts.dateFormat('%Y-%m-%d %H:%M:%S', this.x) + '<br/>' +
            Highcharts.numberFormat(this.y, 2);
         }
      },
      plotOptions: {
         area: {
            pointStart: 1940,
            marker: {
               enabled: false,
               symbol: 'circle',
               radius: 2,
               states: {
                  hover: {
                     enabled: true
                  }
               }
            }
         }
      },
      legend: {
         enabled: false
      },
      exporting : {
         enabled: false
      },
      series : [{
         name: 'Random data',
         data: (function () {
            // generate an array of random data
            var data = [],time = (new Date()).getTime(),i;
            for (i = -19; i <= 0; i += 1) {
               data.push({
                  x: time + i * 1000,
                  y: Math.random()
               });
            }
            return data;
         }())
      }]
   };
}
Result
Verify the result.
angular_highcharts_dynamic_charts.htm

Advertisements