- Angular Highcharts - Home
- Angular Highcharts - Overview
- Environment Setup
- Configuration Syntax
- Angular Highcharts - Line Charts
- Angular Highcharts - Area Charts
- Angular Highcharts - Bar Charts
- Angular Highcharts - Column Charts
- Angular Highcharts - Pie Charts
- Angular Highcharts - Scatter Chart
- Angular Highcharts - Dynamic Charts
- Angular Highcharts - Combinations
- Angular Highcharts - 3D Charts
- Angular Highcharts - Map Charts
Selected Reading
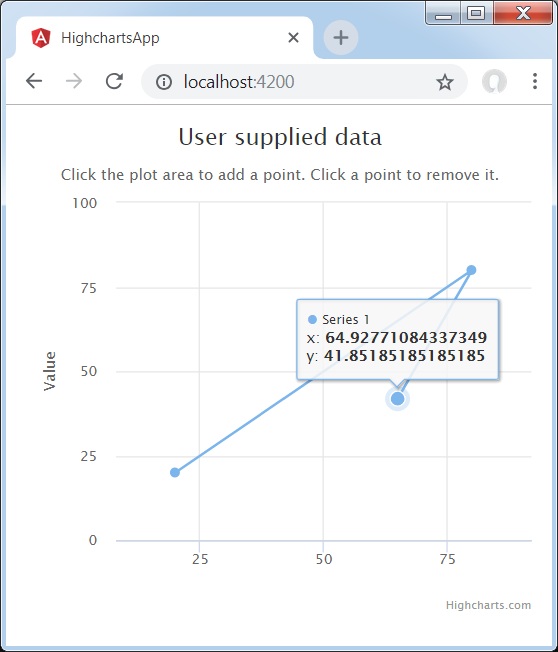
Chart with Point Addition Capability
We have already seen the configuration used to draw a chart in Highcharts Configuration Syntax chapter.
An example of a Chart with point addition capability is given below.
Configurations
Let us now see the additional configurations/steps taken.
chart.events
Add a click method to the chart.event property. This method adds a new point using the x, y co-ordinate of the clicked area in the chart to the series.
events: {
   click: function (e) {
      // find the clicked values and the series
      var x = e.xAxis[0].value,
      y = e.yAxis[0].value,
      series = this.series[0];
      // Add it
      series.addPoint([x, y]);
   }
}
Example
app.component.ts
import { Component } from '@angular/core';
import * as Highcharts from 'highcharts';
@Component({
  selector: 'app-root',
  templateUrl: './app.component.html',
  styleUrls: ['./app.component.css']
})
export class AppComponent {
   highcharts = Highcharts;
   chartOptions = {
      chart : {
         type: 'scatter',
         margin: [70, 50, 60, 80],
         marginRight: 10,
         events: {
            click: function (e) {
              // find the clicked values and the series
              var x = e.xAxis[0].value,
              y = e.yAxis[0].value,
              series = this.series[0];

              // Add it
              series.addPoint([x, y]);
           }
        }
      },
      title : {
         text: 'User supplied data'
      },
      subtitle : {
         text: 'Click the plot area to add a point. Click a point to remove it.'
      },
      xAxis : {
         gridLineWidth: 1,
         minPadding: 0.2,
         maxPadding: 0.2,
         maxZoom: 60
      },
      yAxis : {
         title: {
            text: 'Value'
         },
         minPadding: 0.2,
         maxPadding: 0.2,
         maxZoom: 60,
         plotLines: [{
            value: 0,
            width: 1,
            color: '#808080'
         }]
      },
      plotOptions: {
         series: {
            lineWidth: 1,
            point: {
               events: {
                  'click': function () {
                     if (this.series.data.length > 1) {
                        this.remove();
                     }
                  }
               }
            }
         }
      },
      legend: {
         enabled: false
      },
      exporting : {
         enabled: false
      },
      series : [{
         data: [[20, 20], [80, 80]]
      }]
   };
}
Result
Verify the result.
angular_highcharts_dynamic_charts.htm

Advertisements