- Angular Highcharts - Home
- Angular Highcharts - Overview
- Environment Setup
- Configuration Syntax
- Angular Highcharts - Line Charts
- Angular Highcharts - Area Charts
- Angular Highcharts - Bar Charts
- Angular Highcharts - Column Charts
- Angular Highcharts - Pie Charts
- Angular Highcharts - Scatter Chart
- Angular Highcharts - Dynamic Charts
- Angular Highcharts - Combinations
- Angular Highcharts - 3D Charts
- Angular Highcharts - Map Charts
Selected Reading
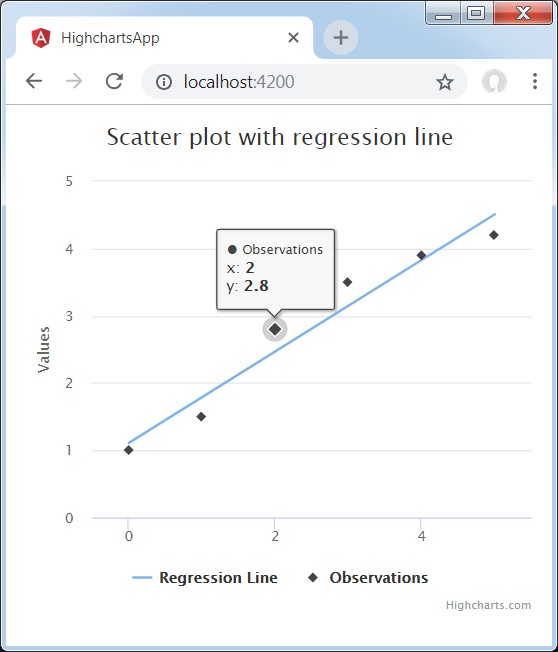
Angular Highcharts - Scatter Chart with Regression Line
Following is an example of a Scatter Chart with Regression Line.
We have already seen the configuration used to draw a chart in Highcharts Configuration Syntax chapter.
An example of a Scatter Chart with Regression Line is given below.
Configurations
Let us now see the additional configurations/steps taken.
series
Configure the chart type to be scatter based. series.type decides the series type for the chart. Here, the default value is "line".
series : [{
   type: 'scatter'
}]
Example
app.component.ts
import { Component } from '@angular/core';
import * as Highcharts from 'highcharts';
@Component({
   selector: 'app-root',
   templateUrl: './app.component.html',
   styleUrls: ['./app.component.css']
})
export class AppComponent {
   highcharts = Highcharts;
   chartOptions = {
      title : {
         text: 'Scatter plot with regression line'
      },
      xAxis : {
         min: -0.5,
         max: 5.5
      },
      yAxis : {
         min: 0
      },
      series : [
      {
         type: 'line',
         name: 'Regression Line',
         data: [[0, 1.11], [5, 4.51]],
         marker: {
            enabled: false
         },
         states: {
            hover: {
               lineWidth: 0
            }
         },
         enableMouseTracking: false
      },
      {
         type: 'scatter',
         name: 'Observations',
         data: [1, 1.5, 2.8, 3.5, 3.9, 4.2],
         marker: {
            radius: 4
         }
      }]
   };
}
Result
Verify the result.
angular_highcharts_combinations.htm

Advertisements