- Angular Highcharts - Home
- Angular Highcharts - Overview
- Environment Setup
- Configuration Syntax
- Angular Highcharts - Line Charts
- Angular Highcharts - Area Charts
- Angular Highcharts - Bar Charts
- Angular Highcharts - Column Charts
- Angular Highcharts - Pie Charts
- Angular Highcharts - Scatter Chart
- Angular Highcharts - Dynamic Charts
- Angular Highcharts - Combinations
- Angular Highcharts - 3D Charts
- Angular Highcharts - Map Charts
Selected Reading
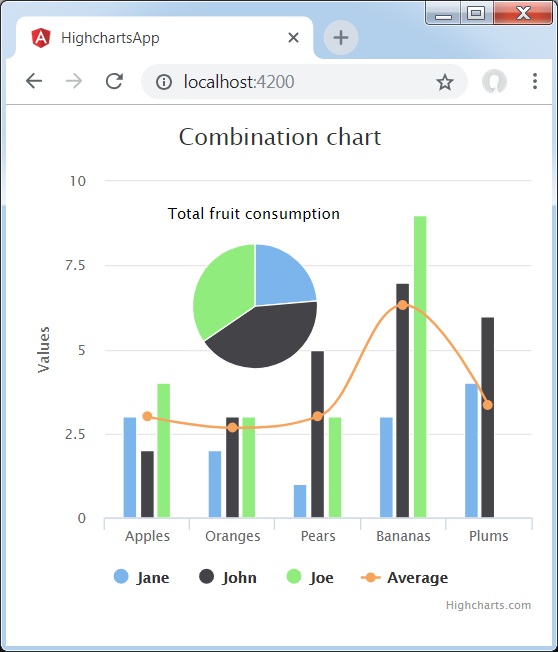
Chart with Column, Line and Pie
Following is an example of a Chart with Column, Line and Pie.
We have already seen the configuration used to draw a chart in Highcharts Configuration Syntax chapter.
An example of a combination chart having Column, Line and Pie is given below.
Configurations
Let us now see the additional configurations/steps taken.
series
Configure the chart type to be scatter based. series.type decides the series type for the chart. Here, the default value is "line".
series : [{
   type: 'column',
   name: 'Jane',
   data: [3, 2, 1, 3, 4]
}]
Example
app.component.ts
import { Component } from '@angular/core';
import * as Highcharts from 'highcharts';
@Component({
   selector: 'app-root',
   templateUrl: './app.component.html',
   styleUrls: ['./app.component.css']
})
export class AppComponent {
   highcharts = Highcharts;
   chartOptions = {
      title : {
         text: 'Combination chart'
      },
      xAxis : {
         categories: ['Apples', 'Oranges', 'Pears', 'Bananas', 'Plums']
      },
      labels : {
         items: [{
            html: 'Total fruit consumption',
            style: {
               left: '50px',
               top: '18px',
               color: (Highcharts.theme && Highcharts.theme.textColor) || 'black'
            }
         }]
      },
      series : [
         {
            type: 'column',
            name: 'Jane',
            data: [3, 2, 1, 3, 4]
         },
         {
            type: 'column',
            name: 'John',
            data: [2, 3, 5, 7, 6]
         },
         {
            type: 'column',
            name: 'Joe',
            data: [4, 3, 3, 9, 0]
         },
         {
            type: 'spline',
            name: 'Average',
            data: [3, 2.67, 3, 6.33, 3.33]
         },
         {
            type: 'pie',
            name: 'Total consumption',
            data: [
               {
                  name: 'Jane',
                  y: 13,
                  color: Highcharts.getOptions().colors[0] // Jane's color
               },
               {
                  name: 'John',
                  y: 23,
                  color: Highcharts.getOptions().colors[1] // John's color
               },
               {
                  name: 'Joe',
                  y: 19,
                  color: Highcharts.getOptions().colors[2] // Joe's color
               }
            ],
            center: [100, 80],
            size: 100,
            showInLegend: false,
            dataLabels: {
               enabled: false
            }
         },
      ]
   };
}
Result
Verify the result.
angular_highcharts_combinations.htm

Advertisements