- Angular Highcharts - Home
- Angular Highcharts - Overview
- Environment Setup
- Configuration Syntax
- Angular Highcharts - Line Charts
- Angular Highcharts - Area Charts
- Angular Highcharts - Bar Charts
- Angular Highcharts - Column Charts
- Angular Highcharts - Pie Charts
- Angular Highcharts - Scatter Chart
- Angular Highcharts - Dynamic Charts
- Angular Highcharts - Combinations
- Angular Highcharts - 3D Charts
- Angular Highcharts - Map Charts
Selected Reading
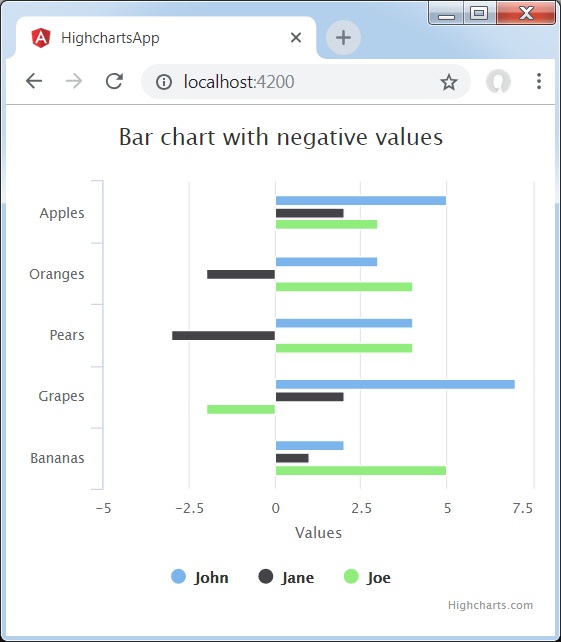
Bar Chart with negative values
Following is an example of a Bar Chart with negative values.
We have already seen the configurations used to draw a chart in Highcharts Configuration Syntax chapter. Now, let us see an example of a basic bar chart with negative values.
Example
app.component.ts
import { Component } from '@angular/core';
import * as Highcharts from 'highcharts';
@Component({
   selector: 'app-root',
   templateUrl: './app.component.html',
   styleUrls: ['./app.component.css']
})
export class AppComponent {
   highcharts = Highcharts;
   chartOptions = {
      chart: {
         type: 'bar'
      },
      title: {
         text: 'Bar chart with negative values'
      },
      xAxis:{
         categories: ['Apples', 'Oranges', 'Pears', 'Grapes', 'Bananas']
      },
      series: [
         {
            name: 'John',
            data: [5, 3, 4, 7, 2]
         },
         {
            name: 'Jane',
            data: [2, -2, -3, 2, 1]
         },
         {
            name: 'Joe',
            data: [3, 4, 4, -2, 5]
         }
      ]
   };
}
Result
Verify the result.
angular_highcharts_bar_charts.htm

Advertisements