- Angular Highcharts - Home
- Angular Highcharts - Overview
- Environment Setup
- Configuration Syntax
- Angular Highcharts - Line Charts
- Angular Highcharts - Area Charts
- Angular Highcharts - Bar Charts
- Angular Highcharts - Column Charts
- Angular Highcharts - Pie Charts
- Angular Highcharts - Scatter Chart
- Angular Highcharts - Dynamic Charts
- Angular Highcharts - Combinations
- Angular Highcharts - 3D Charts
- Angular Highcharts - Map Charts
Selected Reading
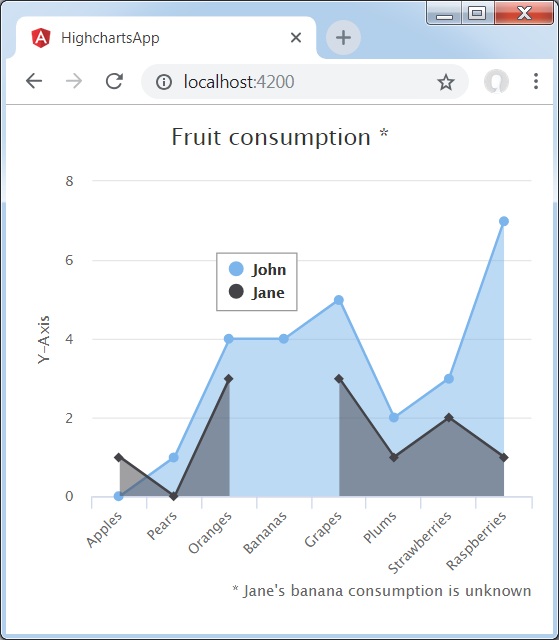
Area Chart with missing values
Following is an example of an area chart with missing values.
We have already seen the configurations used to draw a chart in Highcharts Configuration Syntax chapter. Now, let us see an example of a Area Chart with missing values. We have added spacingBottom attribute in chart.
charts
Configure the spacingBottom of the chart as 30. It signifies the space between the bottom edge of the chart and the content (plot area, axis title and labels, title, subtitle or legend in top position).
var chart = {
   type: 'area',
   spacingBottom: 30
};
Example
app.component.ts
import { Component } from '@angular/core';
import * as Highcharts from 'highcharts';
@Component({
   selector: 'app-root',
   templateUrl: './app.component.html',
   styleUrls: ['./app.component.css']
})
export class AppComponent {
   highcharts = Highcharts;
   chartOptions = {
      chart: {
         type: 'area',
         spacingBottom: 30
      },
      title: {
         text: 'Fruit consumption *'
      },
      subtitle : {
         text: '* Jane\'s banana consumption is unknown',
         floating: true,
         align: 'right',
         verticalAlign: 'bottom',
         y: 15
      },
      legend : {
         layout: 'vertical',
         align: 'left',
         verticalAlign: 'top',
         x: 150,
         y: 100,
         floating: true,
         borderWidth: 1,
         backgroundColor: (
            Highcharts.theme && Highcharts.theme.legendBackgroundColor) || '#FFFFFF'
      },
      xAxis:{
         categories: ['Apples', 'Pears', 'Oranges', 'Bananas', 'Grapes', 'Plums', 'Strawberries', 'Raspberries']
      },
      yAxis : {
         title: {
            text: 'Y-Axis'
         },
         labels: {
            formatter: function () {
               return this.value;
            }
         }
      },
      tooltip : {
         formatter: function () {
            return '<b>' + this.series.name + '</b><br/>' +
               this.x + ': ' + this.y;
         }
      },
      plotOptions : {
         area: {
            fillOpacity: 0.5
         }
      },
      credits:{
         enabled: false
      },
      series: [
         {
            name: 'John',
            data: [0, 1, 4, 4, 5, 2, 3, 7]
         },
         {
            name: 'Jane',
            data: [1, 0, 3, null, 3, 1, 2, 1]
         }
      ]
   };
}
Result
Verify the result.
angular_highcharts_area_charts.htm

Advertisements