- Angular Highcharts - Home
- Angular Highcharts - Overview
- Environment Setup
- Configuration Syntax
- Angular Highcharts - Line Charts
- Angular Highcharts - Area Charts
- Angular Highcharts - Bar Charts
- Angular Highcharts - Column Charts
- Angular Highcharts - Pie Charts
- Angular Highcharts - Scatter Chart
- Angular Highcharts - Dynamic Charts
- Angular Highcharts - Combinations
- Angular Highcharts - 3D Charts
- Angular Highcharts - Map Charts
Selected Reading
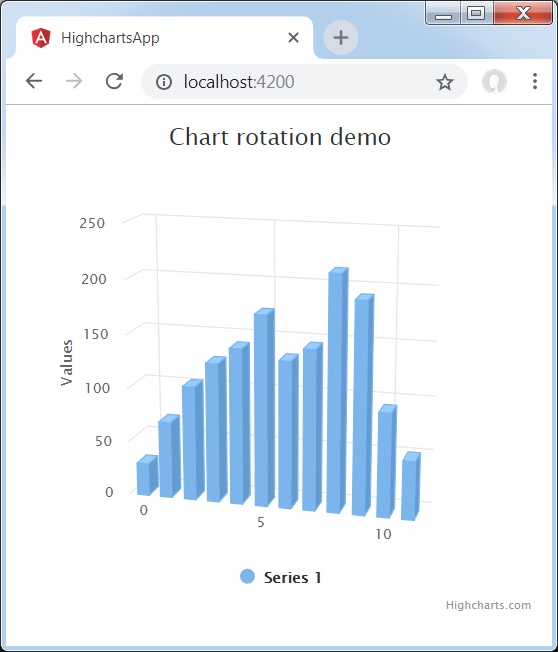
Angular Highcharts - 3D Column Chart
Following is an example of a 3D Column Chart.
We have already seen the configuration used to draw a chart in Highcharts Configuration Syntax chapter.
An example of a 3D Column Chart is given below.
Configurations
Let us now see the additional configurations/steps taken.
option3D
Configure the column chart type to be 3D based. Options3D sets the 3D options enabled.
chart: {
   options3d: {
      enabled: true,
      alpha: 15,
      beta: 15,
      depth: 50,
      viewDistance: 25
   }
}
Example
app.component.ts
import { Component } from '@angular/core';
import * as Highcharts from 'highcharts';
import highcharts3D from 'highcharts/highcharts-3d.src';
highcharts3D(Highcharts);
@Component({
   selector: 'app-root',
   templateUrl: './app.component.html',
   styleUrls: ['./app.component.css']
})
export class AppComponent {
   highcharts = Highcharts;
   chartOptions = {
      chart: {
         renderTo: 'container',
         type: 'column',
         margin: 75,
         options3d: {
            enabled: true,
            alpha: 15,
            beta: 15,
            depth: 50,
            viewDistance: 25
         }
      },
      title : {
         text: 'Chart rotation demo'
      },
      plotOptions : {
         column: {
            depth: 25
         }
      },
      series : [{
         data: [29.9, 71.5, 106.4, 129.2, 144.0, 176.0, 135.6, 148.5, 216.4,
                 194.1, 95.6, 54.4]
      }]
   };
}
Result
Verify the result.
angular_highcharts_3d_charts.htm

Advertisements