- Matplotlib Basics
- Matplotlib - Home
- Matplotlib - Introduction
- Matplotlib - Vs Seaborn
- Matplotlib - Environment Setup
- Matplotlib - Anaconda distribution
- Matplotlib - Jupyter Notebook
- Matplotlib - Pyplot API
- Matplotlib - Simple Plot
- Matplotlib - Saving Figures
- Matplotlib - Markers
- Matplotlib - Figures
- Matplotlib - Styles
- Matplotlib - Legends
- Matplotlib - Colors
- Matplotlib - Colormaps
- Matplotlib - Colormap Normalization
- Matplotlib - Choosing Colormaps
- Matplotlib - Colorbars
- Matplotlib - Text
- Matplotlib - Text properties
- Matplotlib - Subplot Titles
- Matplotlib - Images
- Matplotlib - Image Masking
- Matplotlib - Annotations
- Matplotlib - Arrows
- Matplotlib - Fonts
- Matplotlib - What are Fonts?
- Setting Font Properties Globally
- Matplotlib - Font Indexing
- Matplotlib - Mathematical Expressions
- Matplotlib - Transforms
- Matplotlib - Ticks and Tick Labels
- Matplotlib - Axis Ranges
- Matplotlib - Axis Scales
- Matplotlib - Axis Ticks
- Matplotlib - Formatting Axes
- Matplotlib - Axes Class
- Matplotlib - Twin Axes
- Matplotlib - Figure Class
- Matplotlib - Multiplots
- Matplotlib - Grids
- Matplotlib - Object-oriented Interface
- Matplotlib - PyLab module
- Matplotlib - Subplots() Function
- Matplotlib - Subplot2grid() Function
- Matplotlib - Anchored Artists
- Matplotlib - Manual Contour
- Matplotlib - Coords Report
- Matplotlib - AGG filter
- Matplotlib - Ribbon Box
- Matplotlib - Fill Spiral
- Matplotlib - Findobj Demo
- Matplotlib - Hyperlinks
- Matplotlib - Image Thumbnail
- Matplotlib - Plotting with Keywords
- Matplotlib - Create Logo
- Matplotlib - Multipage PDF
- Matplotlib - Multiprocessing
- Matplotlib - Print Stdout
- Matplotlib - Compound Path
- Matplotlib - Sankey Class
- Matplotlib - MRI with EEG
- Matplotlib - Stylesheets
- Matplotlib - Background Colors
- Matplotlib - Basemap
- Matplotlib Event Handling
- Matplotlib - Event Handling
- Matplotlib - Close Event
- Matplotlib - Mouse Move
- Matplotlib - Click Events
- Matplotlib - Scroll Event
- Matplotlib - Keypress Event
- Matplotlib - Pick Event
- Matplotlib - Looking Glass
- Matplotlib - Path Editor
- Matplotlib - Poly Editor
- Matplotlib - Timers
- Matplotlib - Viewlims
- Matplotlib - Zoom Window
- Matplotlib Plotting
- Matplotlib - Bar Graphs
- Matplotlib - Histogram
- Matplotlib - Pie Chart
- Matplotlib - Scatter Plot
- Matplotlib - Box Plot
- Matplotlib - Violin Plot
- Matplotlib - Contour Plot
- Matplotlib - 3D Plotting
- Matplotlib - 3D Contours
- Matplotlib - 3D Wireframe Plot
- Matplotlib - 3D Surface Plot
- Matplotlib - Quiver Plot
- Matplotlib Useful Resources
- Matplotlib - Quick Guide
- Matplotlib - Useful Resources
- Matplotlib - Discussion
Matplotlib - Textbox
A textbox is an area in a document or on a screen where you can type or display text. It is like a little box where you can input or output words, sentences, or paragraphs. Think of it like this −
Input Textbox − When you see a blank area on a form or a website where you can type your name, email, or any other information, that is a textbox. You can click on it and start typing.
Output Textbox − When you see a section of a webpage or document where there is text displayed, like a message or a description, that's also a textbox. It just shows text instead of letting you type into it.
Textbox in Matplotlib
In Matplotlib, a Textbox is a graphical element used to display text within a plot, providing additional information or annotations. It allows you to include descriptive text, labels, or explanations directly on the plot.
You can create a textbox in Matplotlib using the text() function. In Matplotlib, the function used to create a textbox is plt.text(). This function allows you to add text directly to a plot, specifying the text content and its position within the plot. Additionally, you can customize various attributes of the textbox, such as font style, size, color, alignment, and background color, to suit their visualization needs.
Basic Text Box
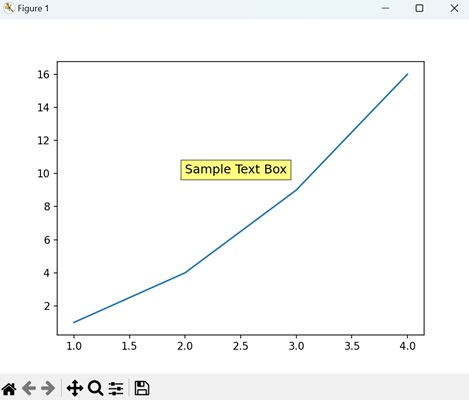
A basic text box in Matplotlib is a simple way to add text to a plot. It allows you to include labels or annotations directly onto the plot. You can specify the content of the text and its position within the plot using the text() function.
Example
In the following example, we are creating a basic text box with the text "Sample Text Box" at the coordinates (2, 10) on the plot −
import matplotlib.pyplot as plt

# Creating a plot
plt.plot([1, 2, 3, 4], [1, 4, 9, 16])

# Adding a basic text box
plt.text(2, 10, 'Sample Text Box', fontsize=12, bbox=dict(facecolor='yellow', alpha=0.5))

# Displaying the plot
plt.show()
Output
Following is the output of the above code −
Rounded Text Box
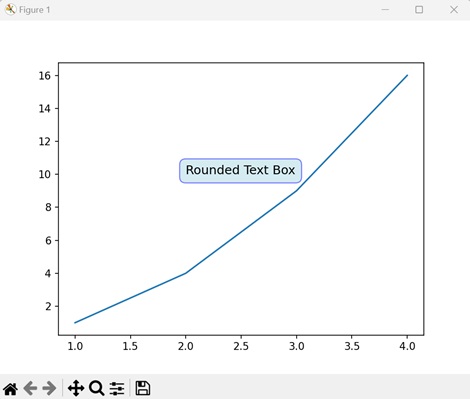
A rounded text box in Matplotlib is a variation of a basic text box with rounded corners. It allows you to add text to a plot within a rectangular-shaped box, but with softened corners.
Example
In here, we are creating a rounded text box with the text "Rounded Text Box" at the coordinates (2, 10) on the plot −
import matplotlib.pyplot as plt

# Creating a plot
plt.plot([1, 2, 3, 4], [1, 4, 9, 16])

# Adding a rounded text box
plt.text(2, 10, 'Rounded Text Box', fontsize=12, bbox=dict(facecolor='lightblue', alpha=0.5, edgecolor='blue', boxstyle='round,pad=0.5'))

# Displaying the plot
plt.show()
Output
On executing the above code we will get the following output −
Custom Text Box with Arrow
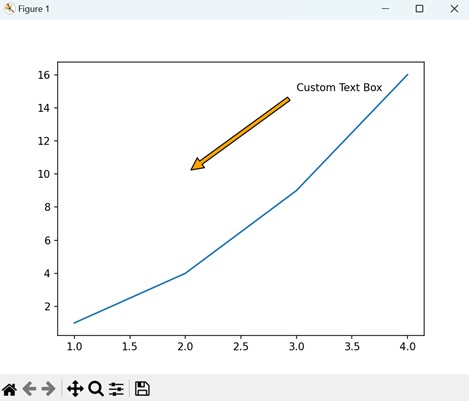
A custom text box with an arrow in Matplotlib is a special type of annotation that combines a text box with an arrow pointing to a specific location on a plot. It is a way to draw attention to particular features or data points within a plot.
Example
The following example creates a custom text box with an arrow pointing to the text "Custom Text Box" at the coordinates (2, 10) on the plot −
import matplotlib.pyplot as plt

# Creating a plot
plt.plot([1, 2, 3, 4], [1, 4, 9, 16])

# Adding a custom text box with arrow
plt.annotate('Custom Text Box', xy=(2, 10), xytext=(3, 15),
   arrowprops=dict(facecolor='orange', shrink=0.05))

# Displaying the plot
plt.show()
Output
After executing the above code, we get the following output −
Multiline Text Box
In Matplotlib, a multiline text box allows you to include multiple lines of text within a single annotation box on a plot. This feature is useful for adding longer explanations, descriptions, or labels that span across multiple lines.
Example
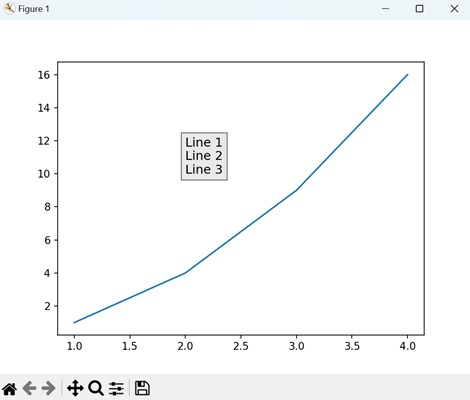
Now, we are creating a multiline text box with three lines of text at the coordinates (2, 10) on the plot. We separate each line by "\n" −
import matplotlib.pyplot as plt

# Creating a plot
plt.plot([1, 2, 3, 4], [1, 4, 9, 16])

# Adding a multiline text box
plt.text(2, 10, 'Line 1\nLine 2\nLine 3', fontsize=12, bbox=dict(facecolor='lightgrey', alpha=0.5))

# Displaying the plot
plt.show()
Output
On executing the above code we will get the following output −
To Continue Learning Please Login