Service Discovery
- Service Discovery Using Eureka
- Spring Cloud - Creating Eureka Server
- Spring Cloud - Creating Eureka Client
- Eureka Client Consumer Example
- Spring Cloud - Eureka Server API
- Spring Cloud - Eureka High Availablity
- Spring Cloud - Eureka Zone Awareness
Synchronous Communication
- Synchronous Communication with Feign Client
- Spring Cloud - Feign Client with Eureka
- Spring Cloud - Testing Feign Client
Synchronous Communication
- Spring Cloud - Gateway
- Spring Cloud - Creating Gateway Application
- Spring Cloud - Testing Gateway Application
- Spring Cloud - Monitoring Gateway Application
Miscellaneous
- Spring Cloud - Load Balancer
- Circuit Breaker using Hystrix
- Streams with Apache Kafka
- Distributed Logging using ELK and Sleuth
Spring Cloud Useful Resources
Selected Reading
Spring Cloud - Distributed Logging using ELK and Sleuth
Introduction
In a distributed environment or in a monolithic environment, application logs are very critical for debugging whenever something goes wrong. In this section, we will look at how to effectively log and improve traceability so that we can easily look at the logs.
Two major reasons why logging patterns become critical for logging −
Inter-service calls − In a microservice architecture, we have async and sync calls between services. It is very critical to link these requests, as there can be more than one level of nesting for a single request.
Intra-service calls − A single service gets multiple requests and the logs for them can easily get intermingled. That is why, having some ID associated with the request becomes important to filter all the logs for a request.
Sleuth is a well-known tool used for logging in application and ELK is used for simpler observation across the system.
Dependency Setting
Let us use the case of Restaurant that we have been using in every chapter. So, let us say we have our Customer service and the Restaurant service communicating via API, i.e., synchronous communication. And we want to have Sleuth for tracing the request and the ELK stack for centralized visualization.
To do that, first setup the ELK stack. To do that, first, we will setup the ELK stack. We will be starting the ELK stack using Docker containers. Here are the images that we can consider −
Once ELK setup has been performed, ensure that it is working as expected by hitting the following APIs −
Elasticsearch − localhost:9200
Kibana − localhost:5601
We will look at logstash configuration file at the end of this section.
Then, let us add the following dependency to our Customer Service and the Restaurant Service −
<dependency>
      <groupId>org.springframework.cloud</groupId>
      <artifactId>spring-cloud-starter-sleuth</artifactId>
</dependency>
Now that we have the dependency setup and ELK running, let us move to the core example.
Request Tracing inside Service
On a very basic level, following are the metadata that are added by Sleuth −
Service name − Service currently processing the request.
Trace Id − A metadata ID is added to the logs which is sent across services for processing an input request. This is useful for inter-service communication for grouping all the internal requests which went in processing one input request.
Span Id − A metadata ID is added to the logs which is same across all log statements which are logged by a service for processing a request. It is useful for intra-service logs. Note that Span ID = Trace Id for the parent service.
Let us see this in action. For that, let us update our Customer Service code to contain log lines. Here is the controller code that we would use.
RestaurantCustomerInstancesController.java
package com.tutorialspoint.eurekaclient;

import java.util.HashMap;
import org.slf4j.Logger;
import org.slf4j.LoggerFactory;
import org.springframework.beans.factory.annotation.Autowired;
import org.springframework.messaging.Message;
import org.springframework.web.bind.annotation.PathVariable;
import org.springframework.web.bind.annotation.RequestMapping;
import org.springframework.web.bind.annotation.RequestMethod;
import org.springframework.web.bind.annotation.RestController;

@RestController
class RestaurantCustomerInstancesController {
   Logger logger =
LoggerFactory.getLogger(RestaurantCustomerInstancesController.class);
   static HashMap<Long, Customer> mockCustomerData = new HashMap();
   static{
      mockCustomerData.put(1L, new Customer(1, "Jane", "DC"));
      mockCustomerData.put(2L, new Customer(2, "John", "SFO"));
      mockCustomerData.put(3L, new Customer(3, "Kate", "NY"));
   }
   @RequestMapping("/customer/{id}")
   public Customer getCustomerInfo(@PathVariable("id") Long id) {
      logger.info("Querying customer with id: " + id);
      Customer customer = mockCustomerData.get(id);
      if(customer != null) {
         logger.info("Found Customer: " + customer);
      }
      return customer;
   }
}
Now let us execute the code, as always, start the Eureka Server. Note that this is not a hard requirement and is present here for the sake of completeness.
Then, let us compile and start updating Customer Service using the following command −
mvn clean install ; java --app_port=8083 -jar .\target\eurekaclient-0.0.1-SNAPSHOT.jar
And we are set, let us now test our code pieces by hitting the API −
curl -X GET http://localhost:8083/customer/1
Here is the output that we will get for this API −
{
   "id": 1,
   "name": "Jane",
   "city": "DC"
}
And now let us check the logs for Customer Service −
2021-03-23 13:46:59.604 INFO [customerservice,
b63d4d0c733cc675,b63d4d0c733cc675] 11860 --- [nio-8083-exec-7]
.t.RestaurantCustomerInstancesController : Querying customer with id: 1
2021-03-23 13:46:59.605 INFO [customerservice,
b63d4d0c733cc675,b63d4d0c733cc675] 11860 --- [nio-8083-exec-7]
.t.RestaurantCustomerInstancesController : Found Customer: Customer [id=1,
name=Jane, city=DC]
..
So, effectively, as we see, we have the name of the service, trace ID, and the span ID added to our log statements.
Request Tracing across Service
Let us see how we can do logging and tracing across service. So, for example, what we will do is to use the Restaurant Service which internally calls the Customer Service.
For that, let us update our Restaurant Service code to contain log lines. Here is the controller code that we would use.
RestaurantController.java
package com.tutorialspoint.eurekaclient;

import java.util.HashMap;
import java.util.List;
import java.util.function.Consumer;
import java.util.function.Supplier;
import java.util.stream.Collectors;
import org.slf4j.Logger;
import org.slf4j.LoggerFactory;
import org.springframework.beans.factory.annotation.Autowired;
import org.springframework.context.annotation.Bean;
import org.springframework.web.bind.annotation.PathVariable;
import org.springframework.web.bind.annotation.RequestMapping;
import org.springframework.web.bind.annotation.RestController;

@RestController
class RestaurantController {
   @Autowired
   CustomerService customerService;
   Logger logger = LoggerFactory.getLogger(RestaurantController.class);
   static HashMap<Long, Restaurant> mockRestaurantData = new HashMap();
   static{
      mockRestaurantData.put(1L, new Restaurant(1, "Pandas", "DC"));
      mockRestaurantData.put(2L, new Restaurant(2, "Indies", "SFO"));
      mockRestaurantData.put(3L, new Restaurant(3, "Little Italy", "DC"));
      mockRestaurantData.put(4L, new Restaurant(4, "Pizeeria", "NY"));
   }
   @RequestMapping("/restaurant/customer/{id}")
   public List<Restaurant> getRestaurantForCustomer(@PathVariable("id") Long id) {
      logger.info("Get Customer from Customer Service with customer id: " + id);
      Customer customer = customerService.getCustomerById(id);
      logger.info("Found following customer: " + customer);
      String customerCity = customer.getCity();
      return mockRestaurantData.entrySet().stream().filter(
      entry -> entry.getValue().getCity().equals(customerCity))
      .map(entry -> entry.getValue())
      .collect(Collectors.toList());
   }
}
Let us compile and start updating Restaurant Service using the following command −
mvn clean install; java --app_port=8082 -jar .\target\eurekaclient-0.0.1-SNAPSHOT.jar
Ensure that we have the Eureka server and the Customer service running. And we are set, let us now test our code pieces by hitting the API −
curl -X GET http://localhost:8082/restaurant/customer/2
Here is the output that we will get for this API −
[
   {
      "id": 2,
      "name": "Indies",
      "city": "SFO"
   }
]
And now, let us check the logs for Restaurant Service −
2021-03-23 14:44:29.381 INFO [restaurantservice,
6e0c5b2a4fc533f8,6e0c5b2a4fc533f8] 19600 --- [nio-8082-exec-6]
com.tutorialspoint.RestaurantController : Get Customer from Customer Service
with customer id: 2
2021-03-23 14:44:29.400 INFO [restaurantservice,
6e0c5b2a4fc533f8,6e0c5b2a4fc533f8] 19600 --- [nio-8082-exec-6]
com.tutorialspoint.RestaurantController : Found following customer: Customer
[id=2, name=John, city=SFO]
Then, let us check the logs for Customer Service −
2021-03-23 14:44:29.392 INFO [customerservice,
6e0c5b2a4fc533f8,f2806826ac76d816] 11860 --- [io-8083-exec-10]
.t.RestaurantCustomerInstancesController : Querying customer with id: 2
2021-03-23 14:44:29.392 INFO [customerservice,
6e0c5b2a4fc533f8,f2806826ac76d816] 11860 --- [io-8083-exec-10]
.t.RestaurantCustomerInstancesController : Found Customer: Customer [id=2,
name=John, city=SFO]..
So, effectively, as we see, we have the name of the service, trace ID, and the span ID added to our log statements. Plus, we see the trace Id, i.e., 6e0c5b2a4fc533f8 being repeated in Customer Service and the Restaurant Service.
Centralized Logging with ELK
What we have seen till now is a way to improve our logging and tracing capability via Sleuth. However, in microservice architecture, we have multiple services running and multiple instances of each service running. It is not practical to look at the logs of each instance to identify the request flow. And that is where ELK helps us.
Let us use the same case of inter-service communication as we did for Sleuth. Let us update our Restaurant and Customer to add logback appenders for the ELK stack.
Before moving ahead, please ensure that ELK stack has been setup and Kibana is accessible at localhost:5601. Also, configure the Lostash configuration with the following setup −
input {
   tcp {
      port => 8089
      codec => json
   }
}
output {
   elasticsearch {
      index => "restaurant"
      hosts => ["http://localhost:9200"]
   }
}
Once this is done, there are two steps we need to do to use logstash in our Spring app. We will perform the following steps for both our services. First, add a dependency for logback to use appender for Logstash.
<dependency>
<groupId>net.logstash.logback</groupId>
   <artifactId>logstash-logback-encoder</artifactId>
   <version>6.6</version>
</dependency>
And secondly, add an appender for logback so that the logback can use this appender to send the data to Logstash
logback.xml
<?xml version="1.0" encoding="UTF-8"?>
<configuration>
   <appender name="logStash"
class="net.logstash.logback.appender.LogstashTcpSocketAppender">
      <destination>10.24.220.239:8089</destination>
      <encoder class="net.logstash.logback.encoder.LogstashEncoder" />
   </appender>
   <appender name="console" class="ch.qos.logback.core.ConsoleAppender">
      <encoder>
         <pattern>%d{HH:mm:ss.SSS} [%thread] %-5level %logger{36} -
%msg%n</pattern>
      </encoder>
   </appender>
   <root level="INFO">
      <appender-ref ref="logStash" />
      <appender-ref ref="console" />
   </root>
</configuration>
The above appender would log to console as well as send the logs to logstash. Now one this is done, we are all set to test this out.
Now, let us execute the above code as always, start the Eureka Server.
Then, let us compile and start updating Customer Service using the following command −
mvn clean install ; java --app_port=8083 -jar .\target\eurekaclient-0.0.1-SNAPSHOT.jar
Then, let us compile and start updating Restaurant Service using the following command −
mvn clean install; java --app_port=8082 -jar .\target\eurekaclient-0.0.1-SNAPSHOT.jar
And we are set, let us now test our code pieces by hitting the API −
curl -X GET http://localhost:8082/restaurant/customer/2
Here is the output that we will get for this API −
[
   {
      "id": 2,
      "name": "Indies",
      "city": "SFO"
   }
]
But more importantly, the log statements would also be available on Kibana.
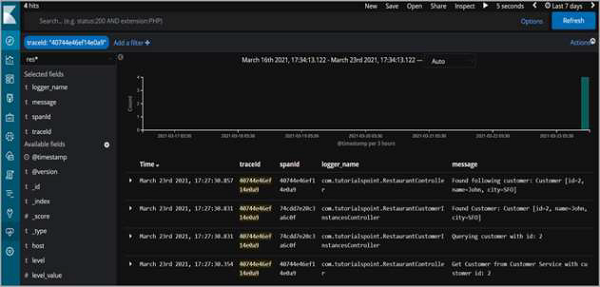
So, as we see, we can filter for a traceId and see all the log statements across services which were logged to fulfill the request.
