Python Seaborn Course
Learn how to use seaborn library for data visualization in python

Lectures -12
Duration -2.5 hours

30-days Money-Back Guarantee
Get your team access to 10000+ top Tutorials Point courses anytime, anywhere.
Course Description
Are you ready to start your path to becoming a Data Scientist!
This comprehensive course will be your guide to learning how to use the power of Python to analyze data, create beautiful visualizations, and use powerful machine learning algorithms!
Data Scientist has been ranked the number one job on Glassdoor and the average salary of a data scientist is over $120,000 in the United States according to Indeed! Data Science is a rewarding career that allows you to solve some of the world's most interesting problems!
This course is designed for both beginners with some programming experience or experienced developers looking to make the jump to Data Science!
1. Seaborn Plotting Functions
2. Plotting with Categorical Data
3. Multi-Plot Grids
4. Plot Aesthetics
Who this course is for:
- Beginner Python developers curious about Data Science
Goals
What will you learn in this course:
- Learn to use Seaborn for statistical plots
- Seaborn Plotting Functions
- Plotting with Categorical Data
- Multi-Plot Grids
- Plot Aesthetics
- Use Plotly for interactive dynamic visualizations
Prerequisites
What are the prerequisites for this course?
- Some programming experience

Curriculum
Check out the detailed breakdown of what’s inside the course
Seaborn with Python
11 Lectures
-
Session 1. Seaborn Plotting Functions 00:56 00:56
-
Seaborn Plotting Functions 30:49 30:49
-
Session 2. Plotting with Categorical Data 00:42 00:42
-
Plotting with Categorical Data 15:40 15:40
-
Session 3. Multi-Plot Grids 00:24 00:24
-
Multi-Plot Grids 33:55 33:55
-
Session 4. Plot Aesthetics 00:28 00:28
-
Plot Aesthetics 17:39 17:39
-
What is Data Science 32:26 32:26
-
Data Visualization using Pandas 19:33 19:33
-
What is Machine Learning 26:33 26:33
Instructor Details

DATAhill Solutions Srinivas Reddy
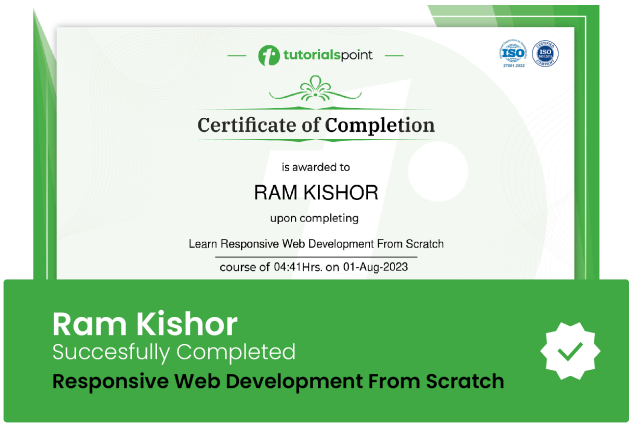
eCourse Certificate
Use your certificate to make a career change or to advance in your current career.

Our students work
with the Best


Related Video Courses
View MoreAnnual Membership
Become a valued member of Tutorials Point and enjoy unlimited access to our vast library of top-rated Video Courses
Subscribe now
Online Certifications
Master prominent technologies at full length and become a valued certified professional.
Explore Now


 Updated on May, 2024
 Language - English