- Microservices Design Patterns - Home
- Microservices Design Patterns - Overview
- Decomposition Design Patterns
- Decompose by Business Capability
- Decompose by Subdomain
- Decompose by Strangler
- Integration Design Patterns
- API Gateway
- Aggregator
- Proxy
- Client Side UI Composition
- Chain Of Responsibilities
- Branch
- Database Design Patterns
- Database per Service
- Shared Database per Service
- Command Query Responsibility Segregator
- Saga
- Aysynchronous Messaging
- Event Sourcing
- Observability Design Patterns
- Log Aggregation
- Performance Metrics
- Distributed Tracing
- Health Check
- Cross Cutting Concern Design Patterns
- External Configuration
- Service Discovery
- Circuit Breaker
- Blue Green Deployment
- Useful Resources
- Quick Guide
- Useful Resources
- Discussion
Distributed Tracing
Problem Statement
Microservice architecture structures an application as a set of loosely coupled microservices and each service can be developed independently in agile manner to enable continous delivery/deployment. Requests often span multiple services. Using external monitoring, we can check overall response time and no. of invocations but how to get insight on individual transactions/operations. A service may use databases, messaging queues, event sourcing etc. How to track scattered logs across multiple services?
Solution
We can instrument a service which is designed to perform the following operations −
Corelation ID − Generate a unique external request id per external request and pass this external id to each service involved in processing the request.
Log the Corelation ID − Each log message generated by processing service should have this correlation id.
Record the Details − Records the start/end time and other relevant details in logs when a request is processed by a service.
Searchable Logs
As logs should be placed at a centralized location, following diagram showcase how to use Kafka, LogStash and Kibana to aggregate logs and search the indexed logs using required filters.
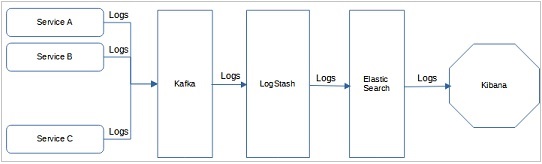
Microservices generates logs, which are published using kafka log appender which then output the log messages to kafka cluster. LogStash ingests the messages from kafka, transforms the messages and publish to elastic search container. Now kibana provides a visual interface to search/read indexed logs from elastic search container and provides required filters.
