- LeafletJS - Home
- LeafletJS - Getting Started
- LeafletJS - Markers
- LeafletJS - Vector Layers
- LeafletJS - Multi Polyline & Polygon
- LeafletJS - Layers Group
- LeafletJS - Event Handling
- LeafletJS - Overlays
- LeafletJS - Controls
LeafletJS - Vector Layers
In the previous chapter, we learned how to use markers in Leaflet. Along with markers, we can also add various shapes such as circles, polygons, rectangles, polylines, etc. In this chapter, we will discuss how to use the shapes provided by Google Maps.
Polyline
To draw polyline overlay on a map using Leaflet JavaScript library, follow the steps given below −
Step 1 − Create a Map object by passing a <div> element (String or object) and map options (optional).
Step 2 − Create a Layer object by passing the URL of the desired tile.
Step 3 − Add the layer object to the map using the addLayer() method of the Map class.
Step 4 − Create a latlangs variable to hold the points to draw polyline, as shown below.
// Creating latlng object
var latlngs = [
   [17.385044, 78.486671],
   [16.506174, 80.648015],
   [17.000538, 81.804034],
   [17.686816, 83.218482]
];
Step 5 − Create a polyline using the L.polyline(). To draw the polyline, pass the locations as variable and an option to specify the color of the lines.
// Creating a poly line
var polyline = L.polyline(latlngs, {color: 'red'});
Step 6 − Add the polyline to the map using the addTo() method of the Polyline class.
// Adding to poly line to map
polyline.addTo(map);
Example
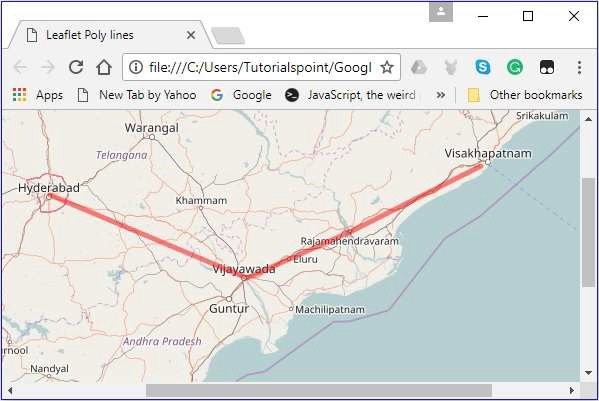
Following is the code which draws a polyline, covering the cities Hyderabad, Vijayawada, Rajamahendrawaram and, Vishakhapatnam (India).
DOCTYPE html>
<html>
   <head>
      <title>Leaflet Poly lines</title>
      <link rel = "stylesheet" href = "http://cdn.leafletjs.com/leaflet-0.7.3/leaflet.css"/>
      <script src = "http://cdn.leafletjs.com/leaflet-0.7.3/leaflet.js"></script>
   </head>

   <body>
      <div id = "map" style = "width:900px; height:580px"></div>
      <script>
         // Creating map options
         var mapOptions = {
            center: [16.506174, 80.648015],
            zoom: 7
         }
         // Creating a map object
         var map = new L.map('map', mapOptions);

         // Creating a Layer object
         var layer = new L.TileLayer('http://{s}.tile.openstreetmap.org/{z}/{x}/{y}.png');

         // Adding layer to the map
         map.addLayer(layer);

         // Creating latlng object
         var latlngs = [
            [17.385044, 78.486671],
            [16.506174, 80.648015],
            [17.000538, 81.804034],
            [17.686816, 83.218482]
         ];
         // Creating a poly line
         var polyline = L.polyline(latlngs, {color: 'red'});

         // Adding to poly line to map
         polyline.addTo(map);
      </script>
   </body>

</html>
It generates the following output
Polygon
To draw a polygon overlay on a map using Leaflet JavaScript library, follow the steps given below −
Step 1 − Create a Map object by passing a <div> element (String or object) and map options (optional).
Step 2 − Create a Layer object by passing the URL of the desired tile.
Step 3 − Add the layer object to the map using the addLayer() method of the Map class.
Step 4 − Create a latlangs variable to hold the points to draw the polygon.
// Creating latlng object
var latlngs = [
   [17.385044, 78.486671],
   [16.506174, 80.648015],
   [17.686816, 83.218482]
];
Step 5 − Create a polygon using the L.polygon(). Pass the locations/points as variable to draw the polygon, and an option to specify the color of the polygon.
// Creating a polygon
var polygon = L.polygon(latlngs, {color: 'red'});
Step 6 − Add the polygon to the map using the addTo() method of the Polygon class.
// Adding to polygon to map
polygon.addTo(map);
Example
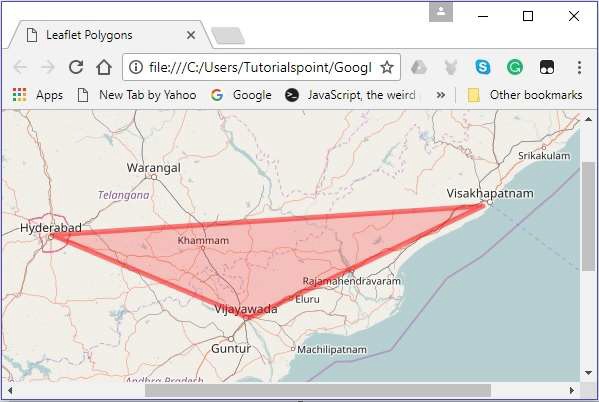
Following is the code to draw a polygon covering the cities Hyderabad, Vijayawada, and Vishakhapatnam (India).
<!DOCTYPE html>
<html>
   <head>
      <title>Leaflet Polygons</title>
      <link rel = "stylesheet" href = "http://cdn.leafletjs.com/leaflet-0.7.3/leaflet.css"/>
      <script src = "http://cdn.leafletjs.com/leaflet-0.7.3/leaflet.js"></script>
   </head>

   <body>
      <div id = "map" style = "width:900px; height:580px"></div>
      <script>
         // Creating map options
         var mapOptions = {
            center: [16.506174, 80.648015],
            zoom: 7
         }
         // Creating a map object
         var map = new L.map('map', mapOptions);

         // Creating a Layer object
         var layer = new L.TileLayer('http://{s}.tile.openstreetmap.org/{z}/{x}/{y}.png');

         // Adding layer to the map
         map.addLayer(layer);

         // Creating latlng object
         var latlngs = [
            [17.385044, 78.486671],
            [16.506174, 80.648015],
            [17.686816, 83.218482]
         ];
         // Creating a polygon
         var polygon = L.polygon(latlngs, {color: 'red'});

         // Adding to polygon to map
         polygon.addTo(map);
      </script>
   </body>

</html>
It generates the following output −
Rectangle
To draw a Rectangle overlay on a map using Leaflet JavaScript library, follow the steps given below
Step 1 − Create a Map object by passing a <div> element (String or object) and map options (optional).
Step 2 − Create a Layer object by passing the URL of the desired tile.
Step 3 − Add the layer object to the map using the addLayer() method of the Map class.
Step 4 − Create a latlangs variable to hold the points to draw a rectangle on the map.
// Creating latlng object
var latlngs = [
   [17.342761, 78.552432],
   [16.396553, 80.727725]
];
Step 5 − Create a rectangle using the L.rectangle() function. Pass the locations/points as a variable to draw a rectangle and rectangleOptions to specify the color and weight of the rectangle.
// Creating rectOptions
var rectOptions = {color: 'Red', weight: 1}

// Creating a rectangle
var rectangle = L.rectangle(latlngs, rectOptions);
Step 6 − Add the rectangle to the map using the addTo() method of the Polygon class.
// Adding to rectangle to map
rectangle.addTo(map);
Example
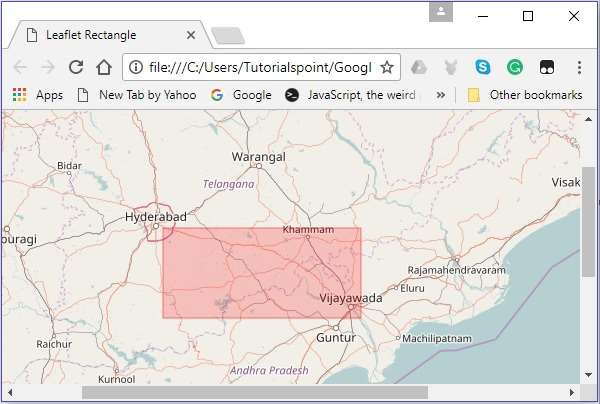
Following is the code to draw a rectangle on the map using Leaflet JavaScript library.
<!DOCTYPE html>
<html>
   <head>
      <title>Leaflet Rectangle</title>
      <link rel = "stylesheet" href = "http://cdn.leafletjs.com/leaflet-0.7.3/leaflet.css"/>
      <script src = "http://cdn.leafletjs.com/leaflet-0.7.3/leaflet.js"></script>
   </head>

   <body>
      <div id = "map" style = "width:900px; height:580px"></div>
      <script>
         // Creating map options
         var mapOptions = {
            center: [16.506174, 80.648015],
            zoom: 7
         }
         var map = new L.map('map', mapOptions); // Creating a map object

         // Creating a Layer object
         var layer = new L.TileLayer('http://{s}.tile.openstreetmap.org/{z}/{x}/{y}.png');
         map.addLayer(layer); // Adding layer to the map

         // Creating latlng object
         var latlngs = [
            [17.342761, 78.552432],
            [16.396553, 80.727725]
         ];
         var rectOptions = {color: 'Red', weight: 1}   // Creating rectOptions

         // Creating a rectangle
         var rectangle = L.rectangle(latlngs, rectOptions);
         rectangle.addTo(map);   // Adding to rectangle to map
      </script>
   </body>

</html>
It generates the following output −
Circle
To draw a circle overlay on a map using Leaflet JavaScript library follow the steps given below.
Step 1 − Create a Map object by passing a <div> element (String or object) and map options (optional).
Step 2 − Create a Layer object by passing the URL of the desired tile.
Step 3 − Add the layer object to the map using the addLayer() method of the Map class.
Step 4 − Create a latlangs variable to hold the center of the circle as shown below.
// Center of the circle
var circleCenter = [17.385044, 78.486671];
Step 5 − Create a variable circleOptions to specify values to the options color, fillColor and, fillOpacity as shown below.
// Circle options
var circleOptions = {
   color: 'red',
   fillColor: '#f03',
   fillOpacity: 0
}
Step 6 − Create a circle using L.circle(). Pass the center of the circle, radius, and the circle options to this function.
// Creating a circle
var circle = L.circle(circleCenter, 50000, circleOptions);
Step 7 − Add the above-created circle to the map using the addTo() method of the Polyline class.
// Adding circle to the map
circle.addTo(map);
Example
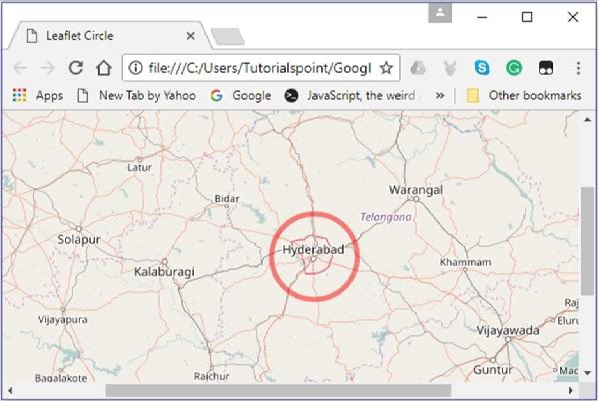
Following is the code to draw a circle with the coordinates of the city Hyderabad as its radius.
<!DOCTYPE html>
<html>
   <head>
      <title>Leaflet Circle</title>
      <link rel = "stylesheet" href = "http://cdn.leafletjs.com/leaflet-0.7.3/leaflet.css"/>
      <script src = "http://cdn.leafletjs.com/leaflet-0.7.3/leaflet.js"></script>
   </head>

   <body>
      <div id = "map" style = "width: 900px; height: 580px"></div>
      <script>
         // Creating map options
         var mapOptions = {
            center: [17.385044, 78.486671],
            zoom: 7
         }
         var map = new L.map('map', mapOptions); // Creating a map object

         // Creating a Layer object
         var layer = new L.TileLayer('http://{s}.tile.openstreetmap.org/{z}/{x}/{y}.png');
         map.addLayer(layer);        // Adding layer to the map
         var circleCenter = [17.385044, 78.486671];     // Center of the circle

         // Circle options
         var circleOptions = {
            color: 'red',
            fillColor: '#f03',
            fillOpacity: 0
         }
         // Creating a circle
         var circle = L.circle(circleCenter, 50000, circleOptions);
         circle.addTo(map);     // Adding circle to the map
      </script>
   </body>

</html>>
It generates the following output −