- Google Colab - Home
- Google Colab - Introduction
- What is Google Colab?
- Your First Colab Notebook
- Documenting Your Code
- Google Colab - Saving Your Work
- Google Colab - Sharing Notebook
- Invoking System Commands
- Executing External Python Files
- Google Colab - Graphical Outputs
- Google Colab - Code Editing Help
- Google Colab - Magics
- Google Colab - Adding Forms
- Google Colab - Installing ML Libraries
- Google Colab - Using Free GPU
- Google Colab - Conclusion
- Google Colab Useful Resources
- Google Colab - Quick Guide
- Google Colab - Useful Resources
- Google Colab - Discussion
Selected Reading
Google Colab - Graphical Outputs
Colab also supports rich outputs such as charts. Type in the following code in the Code cell.
import numpy as np
from matplotlib import pyplot as plt

y = np.random.randn(100)
x = [x for x in range(len(y))]

plt.plot(x, y, '-')
plt.fill_between(x, y, 200, where = (y > 195), facecolor='g', alpha=0.6)

plt.title("Sample Plot")
plt.show()
Now, if you run the code, you will see the following output −
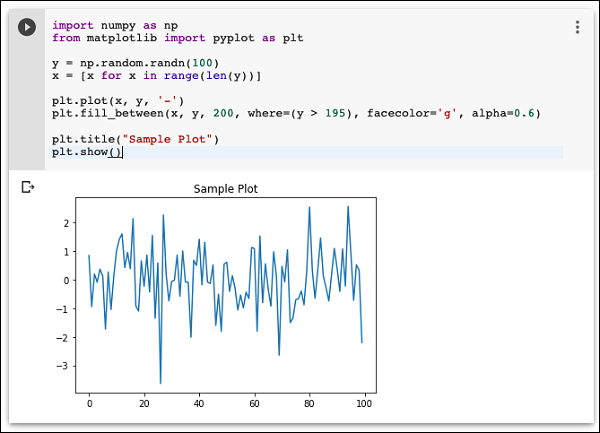
Note that the graphical output is shown in the output section of the Code cell. Likewise, you will be able to create and display several types of charts throughout your program code.
Now, as you have got familiar with the basics of Colab, let us move on to the features in Colab that makes your Python code development easier.

Advertisements