
Article Categories
- All Categories
-
 Data Structure
-
 Networking
-
 RDBMS
RDBMS
-
 Operating System
-
 Java
Java
-
 MS Excel
-
 iOS
iOS
-
 HTML
HTML
-
 CSS
CSS
-
 Android
-
 Python
-
 C Programming
-
 C++
C++
-
 C#
C#
-
 MongoDB
-
 MySQL
MySQL
-
 Javascript
-
 PHP
PHP
Selected Reading
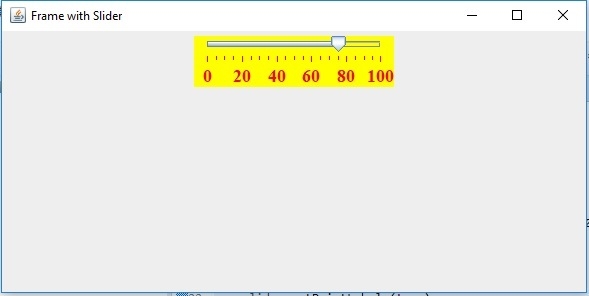
Display tick marks in a JSlider with Java
To display tick marks in a JSlider, you need to use the setPaintTicks() method and set it to TRUE −
JSlider slider = new JSlider(JSlider.HORIZONTAL, 0, 100, 75);
slider.setPaintTicks(true);
The following is an example to display tick marks in a slider in Java −
Example
package my;
import java.awt.Color;
import java.awt.Font;
import javax.swing.JFrame;
import javax.swing.JPanel;
import javax.swing.JSlider;
import javax.swing.WindowConstants;
public class SwingDemo {
   public static void main(String[] args) {
      JFrame frame = new JFrame("Frame with Slider");
      JSlider slider = new JSlider(JSlider.HORIZONTAL, 0, 100, 75);
      slider.setMinorTickSpacing(5);
      slider.setMajorTickSpacing(20);
      slider.setPaintTicks(true);
      slider.setPaintLabels(true);
      slider.setBackground(Color.yellow);
      slider.setForeground(Color.red);
      Font font = new Font("Serif", Font.BOLD, 18);
      slider.setFont(font);
      JPanel panel = new JPanel();
      panel.add(slider);
      frame.add(panel);
      frame.setDefaultCloseOperation(WindowConstants.EXIT_ON_CLOSE);
      frame.setSize(600, 300);
      frame.setVisible(true);
   }
}
Output

Updated on: 2019-07-30T22:30:26+05:30
1K+ Views

Advertisements